RBS 2009 Annual Report Download - page 305
Download and view the complete annual report
Please find page 305 of the 2009 RBS annual report below. You can navigate through the pages in the report by either clicking on the pages listed below, or by using the keyword search tool below to find specific information within the annual report.-
 1
1 -
2
-
3
-
4
-
5
-
6
-
7
-
8
-
9
-
10
-
11
-
12
-
13
-
14
-
15
-
16
-
17
-
18
-
19
-
20
-
21
-
22
-
23
-
24
-
25
-
26
-
27
-
28
-
29
-
30
-
31
-
32
-
33
-
34
-
35
-
36
-
37
-
38
-
39
-
40
-
41
-
42
-
43
-
44
-
45
-
46
-
47
-
48
-
49
-
50
-
51
-
52
-
53
-
54
-
55
-
56
-
57
-
58
-
59
-
60
-
61
-
62
-
63
-
64
-
65
-
66
-
67
-
68
-
69
-
70
-
71
-
72
-
73
-
74
-
75
-
76
-
77
-
78
-
79
-
80
-
81
-
82
-
83
-
84
-
85
-
86
-
87
-
88
-
89
-
90
-
91
-
92
-
93
-
94
-
95
-
96
-
97
-
98
-
99
-
100
-
101
-
102
-
103
-
104
-
105
-
106
-
107
-
108
-
109
-
110
-
111
-
112
-
113
-
114
-
115
-
116
-
117
-
118
-
119
-
120
-
121
-
122
-
123
-
124
-
125
-
126
-
127
-
128
-
129
-
130
-
131
-
132
-
133
-
134
-
135
-
136
-
137
-
138
-
139
-
140
-
141
-
142
-
143
-
144
-
145
-
146
-
147
-
148
-
149
-
150
-
151
-
152
-
153
-
154
-
155
-
156
-
157
-
158
-
159
-
160
-
161
-
162
-
163
-
164
-
165
-
166
-
167
-
168
-
169
-
170
-
171
-
172
-
173
-
174
-
175
-
176
-
177
-
178
-
179
-
180
-
181
-
182
-
183
-
184
-
185
-
186
-
187
-
188
-
189
-
190
-
191
-
192
-
193
-
194
-
195
-
196
-
197
-
198
-
199
-
200
-
201
-
202
-
203
-
204
-
205
-
206
-
207
-
208
-
209
-
210
-
211
-
212
-
213
-
214
-
215
-
216
-
217
-
218
-
219
-
220
-
221
-
222
-
223
-
224
-
225
-
226
-
227
-
228
-
229
-
230
-
231
-
232
-
233
-
234
-
235
-
236
-
237
-
238
-
239
-
240
-
241
-
242
-
243
-
244
-
245
-
246
-
247
-
248
-
249
-
250
-
251
-
252
-
253
-
254
-
255
-
256
-
257
-
258
-
259
-
260
-
261
-
262
-
263
-
264
-
265
-
266
-
267
-
268
-
269
-
270
-
271
-
272
-
273
-
274
-
275
-
276
-
277
-
278
-
279
-
280
-
281
-
282
-
283
-
284
-
285
-
286
-
287
-
288
-
289
-
290
-
291
-
292
-
293
-
294
-
 295
295 -
 296
296 -
 297
297 -
 298
298 -
 299
299 -
 300
300 -
 301
301 -
 302
302 -
 303
303 -
 304
304 -
 305
305 -
 306
306 -
 307
307 -
 308
308 -
 309
309 -
 310
310 -
 311
311 -
 312
312 -
 313
313 -
 314
314 -
 315
315 -
316
-
317
-
318
-
319
-
320
-
321
-
322
-
323
-
324
-
325
-
326
-
327
-
328
-
329
-
330
-
331
-
332
-
333
-
334
-
335
-
336
-
337
-
338
-
339
-
340
-
341
-
342
-
343
-
344
-
345
-
346
-
347
-
348
-
349
-
350
-
351
-
352
-
353
-
354
-
355
-
356
-
357
-
358
-
359
-
360
-
361
-
362
-
363
-
364
-
365
-
366
-
367
-
368
-
369
-
370
-
371
-
372
-
373
-
374
-
375
-
376
-
377
-
378
-
379
-
380
-
381
-
382
-
383
-
384
-
385
-
386
-
387
-
388
-
389
-
390
 |
 |

303RBS Group Annual Report and Accounts 2009
Financial statements
Notes on the accounts
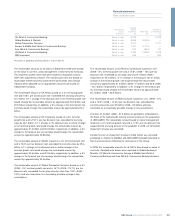
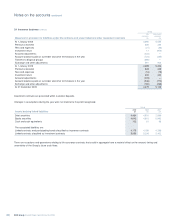
The recoverable amounts for all CGUs in September 2009 were based
on the value in use test, using management’s latest five-year forecasts.
The long-term growth rates have been based on respective country
GDP rates adjusted for inflation. The risk discount rates are based on
observable market long-term government bond yields and average
industry betas adjusted for an appropriate risk premium based on
independent analysis.
The recoverable amount of UK Retail, based on a 4% terminal growth
rate and 14.6% pre tax discount rate, exceeded the carrying amount by
£0.7 billion. A 1% change in the discount rate or the terminal growth rate
would change the recoverable amount by approximately £0.9 billion and
£0.5 billion respectively. In addition, a 5% change in the forecast pre tax
earnings would change the recoverable amount by approximately £0.4
billion.
The recoverable amount of UK Corporate, based on a 4% terminal
growth rate and a 15.1% pre tax discount rate, exceeded its carrying
value by £6.1 billion. A 1% change in the discount rate or similar change
in the terminal growth rate would change the recoverable amount by
approximately £1.4 billion and £0.9 billion respectively. In addition, a 5%
change in the forecast pre tax earnings would change the recoverable
amount by approximately £0.8 billion.
The recoverable amount of Wealth, based on a 4% terminal growth rate
and a 15.3% pre tax discount rate, exceeded its carrying value by £5.6
billion. A 1% change in the discount rate or similar change in the
terminal growth rate would change the recoverable amount by
approximately £0.6 billion and £0.5 billion respectively. In addition, a 5%
change in the forecast pre tax earnings would change the recoverable
amount by approximately £0.4 billion.
The recoverable amount of Global Transaction Services, based on a 3%
(2008 – 3%) terminal growth rate and a 16.7% (2008 – 15.7%) pre tax
discount rate, exceeded its carrying value by more than 100% (2008 –
100%) and was insensitive to a reasonably possible change in key
assumptions.
The recoverable amount of US Retail & Commercial, based on a 5%
(2008 – 5%) terminal growth rate and a 14.8% (2008 – 18%) pre tax
discount rate, exceeded its carrying value by £2.1 billion (2008 –
impairment of £4.4 billion). A 1% change in the discount rate or similar
change in the terminal growth rate would change the recoverable
amount by approximately £1.0 billion (2008 – £1 billion) and £0.8 (2008
– £0.7 billion) respectively. In addition, a 5% change in the forecast pre
tax earnings would change the recoverable amount by approximately
£0.7 billion (2008 – £0.5 billion).
The recoverable amount of RBS Insurance, based on a 3% (2008 – 3%)
and a 13.9% (2008 – 14.6%) pre tax discount rate, exceeded the
carrying amount by over £3 billion (2008 – £3 billion) and was
insensitive to a reasonably possible change in key assumptions.
A further £1.4 billion (2008 – £1.5 billion) of goodwill is attributable to
the State of the Netherlands minority interest arising on the acquisition
of ABN AMRO. The recoverable amount based on latest management
forecasts, a 0% terminal growth rate and a 17.5% pre-tax discount rate
supported the carrying amount of the goodwill. In 2008, a £14.5 billion
impairment charge was recorded.
During the year an impairment charge of £363 million was recorded
principally in relation to NatWest and ABN AMRO goodwill allocated to
Non-Core businesses following the restructure of the Group.
In 2008, the recoverable amounts for all CGUs were based on value in
use tests. Goodwill write downs were recorded in Global Banking &
Markets, US Retail & Commercial, Europe & Middle East Retail &
Commercial Banking and Asia Retail & Commercial Banking divisions.
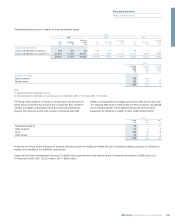
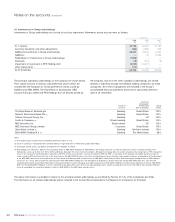
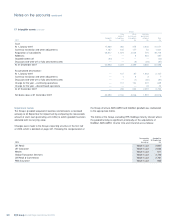
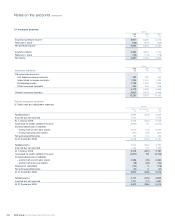
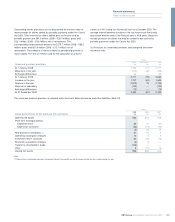
Goodwill
Recoverable prior to Goodwill at
amount write down Write down 31 December
2008 based on: £m £m £m
UK Retail & Commercial Banking Value in use 6,009 — 6,009
Global Banking & Markets Value in use 8,946 (8,946) —
Global Transaction Services Value in use 3,121 — 3,121
Europe & Middle East Retail & Commercial Banking Value in use 1,201 (1,201) —
Asia Retail & Commercial Banking Value in use 970 (863) 107
US Retail & Commercial Banking Value in use 7,405 (4,382) 3,023
RBS Insurance Value in use 935 — 935
The analysis of goodwill by operating segment is shown in Note 38.