RBS 2009 Annual Report Download - page 80
Download and view the complete annual report
Please find page 80 of the 2009 RBS annual report below. You can navigate through the pages in the report by either clicking on the pages listed below, or by using the keyword search tool below to find specific information within the annual report.-
 1
1 -
2
-
3
-
4
-
5
-
6
-
7
-
8
-
9
-
10
-
11
-
12
-
13
-
14
-
15
-
16
-
17
-
18
-
19
-
20
-
21
-
22
-
23
-
24
-
25
-
26
-
27
-
28
-
29
-
30
-
31
-
32
-
33
-
34
-
35
-
36
-
37
-
38
-
39
-
40
-
41
-
42
-
43
-
44
-
45
-
46
-
47
-
48
-
49
-
50
-
51
-
52
-
53
-
54
-
55
-
56
-
57
-
58
-
59
-
60
-
61
-
62
-
63
-
64
-
65
-
66
-
67
-
68
-
69
-
 70
70 -
 71
71 -
 72
72 -
 73
73 -
 74
74 -
 75
75 -
 76
76 -
 77
77 -
 78
78 -
 79
79 -
 80
80 -
 81
81 -
 82
82 -
 83
83 -
 84
84 -
 85
85 -
 86
86 -
 87
87 -
 88
88 -
 89
89 -
 90
90 -
91
-
92
-
93
-
94
-
95
-
96
-
97
-
98
-
99
-
100
-
101
-
102
-
103
-
104
-
105
-
106
-
107
-
108
-
109
-
110
-
111
-
112
-
113
-
114
-
115
-
116
-
117
-
118
-
119
-
120
-
121
-
122
-
123
-
124
-
125
-
126
-
127
-
128
-
129
-
130
-
131
-
132
-
133
-
134
-
135
-
136
-
137
-
138
-
139
-
140
-
141
-
142
-
143
-
144
-
145
-
146
-
147
-
148
-
149
-
150
-
151
-
152
-
153
-
154
-
155
-
156
-
157
-
158
-
159
-
160
-
161
-
162
-
163
-
164
-
165
-
166
-
167
-
168
-
169
-
170
-
171
-
172
-
173
-
174
-
175
-
176
-
177
-
178
-
179
-
180
-
181
-
182
-
183
-
184
-
185
-
186
-
187
-
188
-
189
-
190
-
191
-
192
-
193
-
194
-
195
-
196
-
197
-
198
-
199
-
200
-
201
-
202
-
203
-
204
-
205
-
206
-
207
-
208
-
209
-
210
-
211
-
212
-
213
-
214
-
215
-
216
-
217
-
218
-
219
-
220
-
221
-
222
-
223
-
224
-
225
-
226
-
227
-
228
-
229
-
230
-
231
-
232
-
233
-
234
-
235
-
236
-
237
-
238
-
239
-
240
-
241
-
242
-
243
-
244
-
245
-
246
-
247
-
248
-
249
-
250
-
251
-
252
-
253
-
254
-
255
-
256
-
257
-
258
-
259
-
260
-
261
-
262
-
263
-
264
-
265
-
266
-
267
-
268
-
269
-
270
-
271
-
272
-
273
-
274
-
275
-
276
-
277
-
278
-
279
-
280
-
281
-
282
-
283
-
284
-
285
-
286
-
287
-
288
-
289
-
290
-
291
-
292
-
293
-
294
-
295
-
296
-
297
-
298
-
299
-
300
-
301
-
302
-
303
-
304
-
305
-
306
-
307
-
308
-
309
-
310
-
311
-
312
-
313
-
314
-
315
-
316
-
317
-
318
-
319
-
320
-
321
-
322
-
323
-
324
-
325
-
326
-
327
-
328
-
329
-
330
-
331
-
332
-
333
-
334
-
335
-
336
-
337
-
338
-
339
-
340
-
341
-
342
-
343
-
344
-
345
-
346
-
347
-
348
-
349
-
350
-
351
-
352
-
353
-
354
-
355
-
356
-
357
-
358
-
359
-
360
-
361
-
362
-
363
-
364
-
365
-
366
-
367
-
368
-
369
-
370
-
371
-
372
-
373
-
374
-
375
-
376
-
377
-
378
-
379
-
380
-
381
-
382
-
383
-
384
-
385
-
386
-
387
-
388
-
389
-
390
 |
 |

RBS Group Annual Report and Accounts 200978
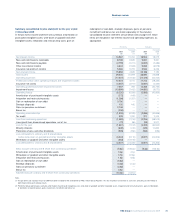
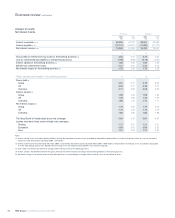
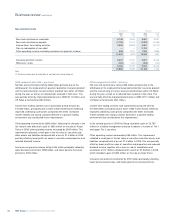
Average balance sheet and related interest Statutory 2009 Statutory 2008
Average Average
balance Interest Rate balance Interest Rate
£m £m % £m £m %
Assets
Loans and advances to banks – UK 21,385 312 1.46 18,909 943 4.99
– Overseas 32,362 613 1.89 31,680 1,465 4.62
Loans and advances to customers – UK 333,707 11,952 3.58 321,066 19,066 5.94
– Overseas 377,019 16,339 4.33 393,724 22,893 5.81
Debt securities – UK 53,955 1,466 2.72 35,725 1,493 4.18
– Overseas 85,410 3,220 3.77 86,090 4,078 4.74
Total interest-earning assets – banking business (2, 3) 903,838 33,902 3.75 887,194 49,938 5.63
– trading business (4) 291,092 425,454
Total interest-earning assets 1,194,930 1,312,648
Non-interest-earning assets (2, 3) 828,550 728,037
Total assets 2,023,480 2,040,685
Percentage of assets applicable to overseas operations 47.4% 48.6%
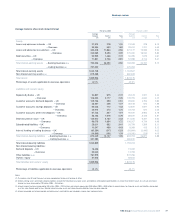
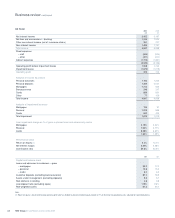
Liabilities and owners’ equity
Deposits by banks – UK 24,837 679 2.73 46,217 1,804 3.90
– Overseas 104,396 2,362 2.26 113,592 4,772 4.20
Customer accounts: demand deposits – UK 110,294 569 0.52 99,852 2,829 2.83
– Overseas 82,177 1,330 1.62 70,399 1,512 2.15
Customer accounts: savings deposits – UK 54,270 780 1.44 42,870 1,708 3.98
– Overseas 83,388 2,114 2.54 72,473 2,203 3.04
Customer accounts: other time deposits – UK 69,687 932 1.34 95,181 4,011 4.21
– Overseas 72,391 2,255 3.12 106,306 4,097 3.85
Debt securities in issue – UK 130,002 3,162 2.43 111,099 4,617 4.16
– Overseas 122,247 2,500 2.05 138,297 6,171 4.46
Subordinated liabilities – UK 26,710 852 3.19 26,799 1,369 5.11
– Overseas 13,152 656 4.99 13,019 788 6.05
Internal funding of trading business – UK (60,284) (317) 0.53 (85,664) (3,445) 4.02
– Overseas (14,845) (192) 1.29 (18,090) (729) 4.03
Total interest-bearing liabilities – banking business (2, 3) 818,422 17,682 2.16 832,350 31,707 3.81
– trading business (4) 331,380 466,610
Total interest-bearing liabilities 1,149,802 1,298,960
Non-interest-bearing liabilities:
Demand deposits – UK 16,456 19,796
– Overseas 27,149 17,625
Other liabilities (3, 4) 772,770 645,760
Owners’ equity 57,303 58,544
Total liabilities and owners’ equity 2,023,480 2,040,685
Percentage of liabilities applicable to overseas operations 45.8% 47.2%
Notes:
(1) The analysis into UK and Overseas has been compiled on the basis of location of office.
(2) Interest-earning assets and interest-bearing liabilities exclude the Retail bancassurance assets and liabilities attributable to policyholders, in view of their distinct nature. As a result, net interest
income has been increased by £20 million (2008 – £84 million).
(3) Interest income has been increased by £46 million (2008 – £332 million) and interest expense by £350 million (2008 – £860 million) to record interest on financial assets and liabilities designated
as at fair value through profit or loss. Related interest-earning assets and interest-bearing liabilities have also been adjusted.
(4) Interest receivable and interest payable on trading assets and liabilities are included in income from trading activities.
Business review continued