RBS 2009 Annual Report Download - page 82
Download and view the complete annual report
Please find page 82 of the 2009 RBS annual report below. You can navigate through the pages in the report by either clicking on the pages listed below, or by using the keyword search tool below to find specific information within the annual report.-
 1
1 -
2
-
3
-
4
-
5
-
6
-
7
-
8
-
9
-
10
-
11
-
12
-
13
-
14
-
15
-
16
-
17
-
18
-
19
-
20
-
21
-
22
-
23
-
24
-
25
-
26
-
27
-
28
-
29
-
30
-
31
-
32
-
33
-
34
-
35
-
36
-
37
-
38
-
39
-
40
-
41
-
42
-
43
-
44
-
45
-
46
-
47
-
48
-
49
-
50
-
51
-
52
-
53
-
54
-
55
-
56
-
57
-
58
-
59
-
60
-
61
-
62
-
63
-
64
-
65
-
66
-
67
-
68
-
69
-
70
-
71
-
 72
72 -
 73
73 -
 74
74 -
 75
75 -
 76
76 -
 77
77 -
 78
78 -
 79
79 -
 80
80 -
 81
81 -
 82
82 -
 83
83 -
 84
84 -
 85
85 -
 86
86 -
 87
87 -
 88
88 -
 89
89 -
 90
90 -
 91
91 -
 92
92 -
93
-
94
-
95
-
96
-
97
-
98
-
99
-
100
-
101
-
102
-
103
-
104
-
105
-
106
-
107
-
108
-
109
-
110
-
111
-
112
-
113
-
114
-
115
-
116
-
117
-
118
-
119
-
120
-
121
-
122
-
123
-
124
-
125
-
126
-
127
-
128
-
129
-
130
-
131
-
132
-
133
-
134
-
135
-
136
-
137
-
138
-
139
-
140
-
141
-
142
-
143
-
144
-
145
-
146
-
147
-
148
-
149
-
150
-
151
-
152
-
153
-
154
-
155
-
156
-
157
-
158
-
159
-
160
-
161
-
162
-
163
-
164
-
165
-
166
-
167
-
168
-
169
-
170
-
171
-
172
-
173
-
174
-
175
-
176
-
177
-
178
-
179
-
180
-
181
-
182
-
183
-
184
-
185
-
186
-
187
-
188
-
189
-
190
-
191
-
192
-
193
-
194
-
195
-
196
-
197
-
198
-
199
-
200
-
201
-
202
-
203
-
204
-
205
-
206
-
207
-
208
-
209
-
210
-
211
-
212
-
213
-
214
-
215
-
216
-
217
-
218
-
219
-
220
-
221
-
222
-
223
-
224
-
225
-
226
-
227
-
228
-
229
-
230
-
231
-
232
-
233
-
234
-
235
-
236
-
237
-
238
-
239
-
240
-
241
-
242
-
243
-
244
-
245
-
246
-
247
-
248
-
249
-
250
-
251
-
252
-
253
-
254
-
255
-
256
-
257
-
258
-
259
-
260
-
261
-
262
-
263
-
264
-
265
-
266
-
267
-
268
-
269
-
270
-
271
-
272
-
273
-
274
-
275
-
276
-
277
-
278
-
279
-
280
-
281
-
282
-
283
-
284
-
285
-
286
-
287
-
288
-
289
-
290
-
291
-
292
-
293
-
294
-
295
-
296
-
297
-
298
-
299
-
300
-
301
-
302
-
303
-
304
-
305
-
306
-
307
-
308
-
309
-
310
-
311
-
312
-
313
-
314
-
315
-
316
-
317
-
318
-
319
-
320
-
321
-
322
-
323
-
324
-
325
-
326
-
327
-
328
-
329
-
330
-
331
-
332
-
333
-
334
-
335
-
336
-
337
-
338
-
339
-
340
-
341
-
342
-
343
-
344
-
345
-
346
-
347
-
348
-
349
-
350
-
351
-
352
-
353
-
354
-
355
-
356
-
357
-
358
-
359
-
360
-
361
-
362
-
363
-
364
-
365
-
366
-
367
-
368
-
369
-
370
-
371
-
372
-
373
-
374
-
375
-
376
-
377
-
378
-
379
-
380
-
381
-
382
-
383
-
384
-
385
-
386
-
387
-
388
-
389
-
390
 |
 |

RBS Group Annual Report and Accounts 200980
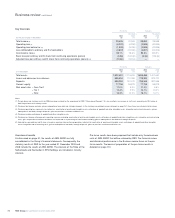
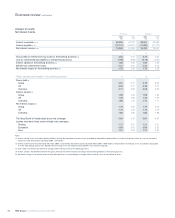
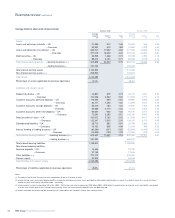
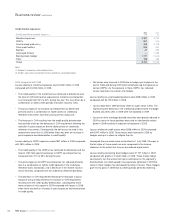
Non-interest income Pro forma (1) Statutory
2009 2008 2009 2008
£m £m £m £m
Fees and commissions receivable 8,738 8,845 9,831 9,831
Fees and commissions payable (2,790) (2,411) (2,822) (2,386)
Income/(loss) from trading activities 3,806 (8,829) 3,881 (8,477)
Gain on redemption of own debt ——3,790 —
Other operating income (excluding insurance net premium income) 838 1,521 1,962 1,899
10,592 (874) 16,642 867
Insurance premium income 5,529 6,009 5,807 6,626
Reinsurers’ share (263) (300) (263) (300)
5,266 5,709 5,544 6,326
15,858 4,835 22,186 7,193
Note:
(1) Pro forma excludes gain on redemption of own debt and strategic disposals.
2009 compared with 2008 – pro forma
Net fees and commissions fell by £486 million primarily due to the
withdrawal of the single premium payment protection insurance product
and the restructuring of current account overdraft fees within UK Retail
during the year, as well as to reduced fees received in Non-Core. This
was partially offset by improved performance in GBM (£112 million) and
US Retail & Commercial (£50 million).
Income from trading activities rose substantially during the year by
£12,635 million, principally due to lower credit market losses reflecting
improved underlying asset prices compared with 2008. Increased
market volatility and strong customer demand in a positive trading
environment also contributed to this improvement.
Other operating income fell by £683 million. Adjusting for changes in the
fair value of own debt and a gain of £600 million on the sale of Angel
Trains in 2008, other operating income increased by £843 million. This
improvement reflected a small gain in the fair value of securities and
other assets and liabilities compared with a loss of £1.4 billion in 2008
partially offset by lower profits on sales of securities and properties and
reduced dividend income.
Insurance net premium income fell by £443 million principally reflecting
lower bancassurance fees, £288 million, and lower general insurance
premiums, £155 million.
2009 compared with 2008 – statutory
Net fees and commissions fell by £436 million primarily due to the
withdrawal of the single premium payment protection insurance product
and the restructuring of current account overdraft fees within UK Retail
during the year, as well as to reduced fees received in Non-Core. This
was partially offset by improved performance in GBM (£112 million) and
US Retail & Commercial (£50 million).
Income from trading activities rose substantially during the year by
£12,358 million, principally due to lower credit market losses reflecting
improved underlying asset prices compared with 2008. Increased
market volatility and strong customer demand in a positive trading
environment also contributed to this improvement.
In the second quarter of 2009 the Group recorded a gain of £3,790
million on a liability management exercise to redeem a number of Tier 1
and upper Tier 2 securities.
Other operating income increased by £63 million. This improvement
reflected a small gain in the fair value of securities and other assets and
liabilities compared with a loss of £1.4 billion in 2008. This was partially
offset by lower profits on sales of securities and properties and reduced
dividend income, together with a loss on sale of subsidiaries and
associates of £0.1 billion compared with a profit of £0.9 billion in 2008,
which included a gain of £600 million on the sale of Angel Trains.
Insurance net premium income fell by £782 million principally reflecting
lower bancassurance fees, and lower general insurance premiums.
Business review continued