RBS 2009 Annual Report Download - page 291
Download and view the complete annual report
Please find page 291 of the 2009 RBS annual report below. You can navigate through the pages in the report by either clicking on the pages listed below, or by using the keyword search tool below to find specific information within the annual report.-
 1
1 -
2
-
3
-
4
-
5
-
6
-
7
-
8
-
9
-
10
-
11
-
12
-
13
-
14
-
15
-
16
-
17
-
18
-
19
-
20
-
21
-
22
-
23
-
24
-
25
-
26
-
27
-
28
-
29
-
30
-
31
-
32
-
33
-
34
-
35
-
36
-
37
-
38
-
39
-
40
-
41
-
42
-
43
-
44
-
45
-
46
-
47
-
48
-
49
-
50
-
51
-
52
-
53
-
54
-
55
-
56
-
57
-
58
-
59
-
60
-
61
-
62
-
63
-
64
-
65
-
66
-
67
-
68
-
69
-
70
-
71
-
72
-
73
-
74
-
75
-
76
-
77
-
78
-
79
-
80
-
81
-
82
-
83
-
84
-
85
-
86
-
87
-
88
-
89
-
90
-
91
-
92
-
93
-
94
-
95
-
96
-
97
-
98
-
99
-
100
-
101
-
102
-
103
-
104
-
105
-
106
-
107
-
108
-
109
-
110
-
111
-
112
-
113
-
114
-
115
-
116
-
117
-
118
-
119
-
120
-
121
-
122
-
123
-
124
-
125
-
126
-
127
-
128
-
129
-
130
-
131
-
132
-
133
-
134
-
135
-
136
-
137
-
138
-
139
-
140
-
141
-
142
-
143
-
144
-
145
-
146
-
147
-
148
-
149
-
150
-
151
-
152
-
153
-
154
-
155
-
156
-
157
-
158
-
159
-
160
-
161
-
162
-
163
-
164
-
165
-
166
-
167
-
168
-
169
-
170
-
171
-
172
-
173
-
174
-
175
-
176
-
177
-
178
-
179
-
180
-
181
-
182
-
183
-
184
-
185
-
186
-
187
-
188
-
189
-
190
-
191
-
192
-
193
-
194
-
195
-
196
-
197
-
198
-
199
-
200
-
201
-
202
-
203
-
204
-
205
-
206
-
207
-
208
-
209
-
210
-
211
-
212
-
213
-
214
-
215
-
216
-
217
-
218
-
219
-
220
-
221
-
222
-
223
-
224
-
225
-
226
-
227
-
228
-
229
-
230
-
231
-
232
-
233
-
234
-
235
-
236
-
237
-
238
-
239
-
240
-
241
-
242
-
243
-
244
-
245
-
246
-
247
-
248
-
249
-
250
-
251
-
252
-
253
-
254
-
255
-
256
-
257
-
258
-
259
-
260
-
261
-
262
-
263
-
264
-
265
-
266
-
267
-
268
-
269
-
270
-
271
-
272
-
273
-
274
-
275
-
276
-
277
-
278
-
279
-
280
-
 281
281 -
 282
282 -
 283
283 -
 284
284 -
 285
285 -
 286
286 -
 287
287 -
 288
288 -
 289
289 -
 290
290 -
 291
291 -
 292
292 -
 293
293 -
 294
294 -
 295
295 -
 296
296 -
 297
297 -
 298
298 -
 299
299 -
 300
300 -
 301
301 -
302
-
303
-
304
-
305
-
306
-
307
-
308
-
309
-
310
-
311
-
312
-
313
-
314
-
315
-
316
-
317
-
318
-
319
-
320
-
321
-
322
-
323
-
324
-
325
-
326
-
327
-
328
-
329
-
330
-
331
-
332
-
333
-
334
-
335
-
336
-
337
-
338
-
339
-
340
-
341
-
342
-
343
-
344
-
345
-
346
-
347
-
348
-
349
-
350
-
351
-
352
-
353
-
354
-
355
-
356
-
357
-
358
-
359
-
360
-
361
-
362
-
363
-
364
-
365
-
366
-
367
-
368
-
369
-
370
-
371
-
372
-
373
-
374
-
375
-
376
-
377
-
378
-
379
-
380
-
381
-
382
-
383
-
384
-
385
-
386
-
387
-
388
-
389
-
390
 |
 |

Financial statements
Notes on the accounts
289RBS Group Annual Report and Accounts 2009
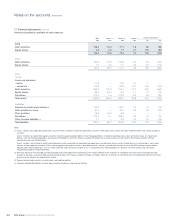
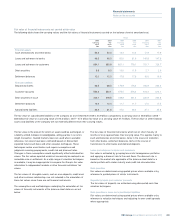
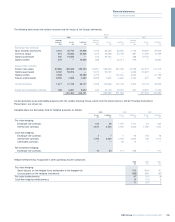
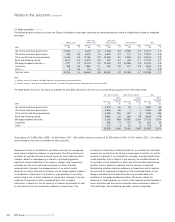
Fair value of financial instruments not carried at fair value
The following table shows the carrying values and the fair values of financial instruments carried on the balance sheet at amortised cost.
Group
2009 2009 2008 2008 2007 2007
Carrying Fair Carrying Fair Carrying Fair
value value value value value value
£bn £bn £bn £bn £bn £bn
Financial assets
Cash and balances at central banks 52.3 52.3 12.4 12.4 17.9 17.9
Loans and advances to banks 46.3 46.0 82.0 81.9 147.8 147.8
Loans and advances to customers 684.1 650.9 821.1 776.1 721.7 723.7
Debt securities 9.9 9.0 13.0 11.5 2.7 2.6
Settlement balances 12.0 12.0 17.8 17.8 16.6 16.6
Financial liabilities
Deposits by banks 88.5 88.3 176.9 176.3 246.8 246.6
Customer accounts 552.8 552.1 575.5 576.4 614.4 614.1
Debt securities in issue 222.1 218.5 248.8 241.3 222.9 222.8
Settlement balances 10.4 10.4 11.7 11.7 17.5 17.5
Subordinated liabilities 36.4 31.6 47.6 36.4 37.1 35.8
The fair value of subordinated liabilities of the company as at 31 December 2009 is £4.9 billion compared to a carrying value of £8.8 billion (2008 –
£8.8 billion fair value on a carrying value of £10.3 billion; 2007 – £7.0 billion fair value on a carrying value £7.7 billion). The fair value of other financial
assets and liabilities of the company are not materially different from their carrying values.
The fair value is the amount for which an asset could be exchanged, or
a liability settled, between knowledgeable, willing parties in an arm’s
length transaction. Quoted market values are used where available;
otherwise, fair values have been estimated based on discounted
expected future cash flows and other valuation techniques. These
techniques involve uncertainties and require assumptions and
judgments covering prepayments, credit risk and discount rates.
Changes in these assumptions would significantly affect estimated fair
values. The fair values reported would not necessarily be realised in an
immediate sale or settlement. As a wide range of valuation techniques
is available, it may be inappropriate to compare the Group’s fair value
information to independent markets or other financial institutions’ fair
values.
The fair values of intangible assets, such as core deposits, credit card
and other customer relationships are not included in the calculation of
these fair values since these are not financial instruments.
The assumptions and methodologies underlying the calculation of fair
values of financial instruments at the balance sheet date are set out
below:
The fair value of financial instruments which are of short maturity (3
months or less) approximates their carrying value. This applies mainly to
cash and balances at central banks, items in the course of collection
from other banks, settlement balances, items in the course of
transmission to other banks and demand deposits.
Loans and advances to banks and customers
Fair value is estimated by grouping loans into homogeneous portfolios
and applying a discount rate to the cash flows. The discount rate is
based on the market rate applicable at the balance sheet date for a
similar portfolio with similar maturity and credit risk characteristics.
Debt securities
Fair values are determined using quoted prices where available or by
reference to quoted prices of similar instruments.
Deposits by banks and customer accounts
The fair values of deposits are estimated using discounted cash flow
valuation techniques.
Debt securities in issue and subordinated liabilities
Fair values are determined using quoted prices where available or by
reference to valuation techniques and adjusting for own credit spreads
where appropriate.