RBS 2009 Annual Report Download - page 109
Download and view the complete annual report
Please find page 109 of the 2009 RBS annual report below. You can navigate through the pages in the report by either clicking on the pages listed below, or by using the keyword search tool below to find specific information within the annual report.-
 1
1 -
2
-
3
-
4
-
5
-
6
-
7
-
8
-
9
-
10
-
11
-
12
-
13
-
14
-
15
-
16
-
17
-
18
-
19
-
20
-
21
-
22
-
23
-
24
-
25
-
26
-
27
-
28
-
29
-
30
-
31
-
32
-
33
-
34
-
35
-
36
-
37
-
38
-
39
-
40
-
41
-
42
-
43
-
44
-
45
-
46
-
47
-
48
-
49
-
50
-
51
-
52
-
53
-
54
-
55
-
56
-
57
-
58
-
59
-
60
-
61
-
62
-
63
-
64
-
65
-
66
-
67
-
68
-
69
-
70
-
71
-
72
-
73
-
74
-
75
-
76
-
77
-
78
-
79
-
80
-
81
-
82
-
83
-
84
-
85
-
86
-
87
-
88
-
89
-
90
-
91
-
92
-
93
-
94
-
95
-
96
-
97
-
98
-
 99
99 -
 100
100 -
 101
101 -
 102
102 -
 103
103 -
 104
104 -
 105
105 -
 106
106 -
 107
107 -
 108
108 -
 109
109 -
 110
110 -
 111
111 -
 112
112 -
 113
113 -
 114
114 -
 115
115 -
 116
116 -
 117
117 -
 118
118 -
 119
119 -
120
-
121
-
122
-
123
-
124
-
125
-
126
-
127
-
128
-
129
-
130
-
131
-
132
-
133
-
134
-
135
-
136
-
137
-
138
-
139
-
140
-
141
-
142
-
143
-
144
-
145
-
146
-
147
-
148
-
149
-
150
-
151
-
152
-
153
-
154
-
155
-
156
-
157
-
158
-
159
-
160
-
161
-
162
-
163
-
164
-
165
-
166
-
167
-
168
-
169
-
170
-
171
-
172
-
173
-
174
-
175
-
176
-
177
-
178
-
179
-
180
-
181
-
182
-
183
-
184
-
185
-
186
-
187
-
188
-
189
-
190
-
191
-
192
-
193
-
194
-
195
-
196
-
197
-
198
-
199
-
200
-
201
-
202
-
203
-
204
-
205
-
206
-
207
-
208
-
209
-
210
-
211
-
212
-
213
-
214
-
215
-
216
-
217
-
218
-
219
-
220
-
221
-
222
-
223
-
224
-
225
-
226
-
227
-
228
-
229
-
230
-
231
-
232
-
233
-
234
-
235
-
236
-
237
-
238
-
239
-
240
-
241
-
242
-
243
-
244
-
245
-
246
-
247
-
248
-
249
-
250
-
251
-
252
-
253
-
254
-
255
-
256
-
257
-
258
-
259
-
260
-
261
-
262
-
263
-
264
-
265
-
266
-
267
-
268
-
269
-
270
-
271
-
272
-
273
-
274
-
275
-
276
-
277
-
278
-
279
-
280
-
281
-
282
-
283
-
284
-
285
-
286
-
287
-
288
-
289
-
290
-
291
-
292
-
293
-
294
-
295
-
296
-
297
-
298
-
299
-
300
-
301
-
302
-
303
-
304
-
305
-
306
-
307
-
308
-
309
-
310
-
311
-
312
-
313
-
314
-
315
-
316
-
317
-
318
-
319
-
320
-
321
-
322
-
323
-
324
-
325
-
326
-
327
-
328
-
329
-
330
-
331
-
332
-
333
-
334
-
335
-
336
-
337
-
338
-
339
-
340
-
341
-
342
-
343
-
344
-
345
-
346
-
347
-
348
-
349
-
350
-
351
-
352
-
353
-
354
-
355
-
356
-
357
-
358
-
359
-
360
-
361
-
362
-
363
-
364
-
365
-
366
-
367
-
368
-
369
-
370
-
371
-
372
-
373
-
374
-
375
-
376
-
377
-
378
-
379
-
380
-
381
-
382
-
383
-
384
-
385
-
386
-
387
-
388
-
389
-
390
 |
 |

107RBS Group Annual Report and Accounts 2009
Business review
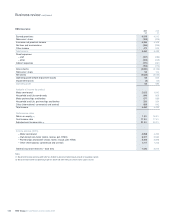
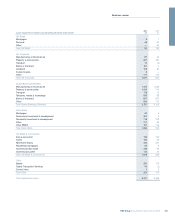
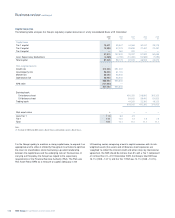
Employee numbers at 31 December
(full time equivalents rounded to the nearest hundred)
2009 2008
UK Retail 25,500 28,400
UK Corporate 12,300 13,400
Wealth 4,600 5,200
Global Banking & Markets 16,800 16,500
Global Transaction Services 3,500 3,900
Ulster Bank 4,500 5,400
US Retail & Commercial 15,500 16,200
RBS Insurance 13,900 14,500
Central items 4,200 4,300
Core 100,800 107,800
Non-Core 15,100 19,000
115,900 126,800
Business services 44,200 47,600
Integration 500 900
RFS Holdings minority interest 23,100 24,500
Group total 183,700 199,800
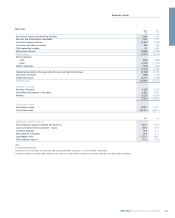
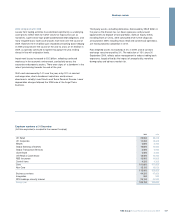
2009 compared with 2008
Losses from trading activities have declined significantly as underlying
asset prices rallied. Mark to market values for exposures such as
monolines, super senior high grade collateralised debt obligations, and
many negative basis trade asset classes have risen over the course of
2009. However, the £1.6 billion gain recorded on banking book hedging
in 2008 unwound over the course of the year to a loss of £1.6 billion in
2009, as spreads continued to tighten throughout the year, ending
almost in line with origination levels.
Impairment losses increased to £9.2 billion, reflecting continued
weakness in the economic environment, particularly across the
corporate and property sectors. There were signs of a slowdown in the
rate of provisioning towards the end of the year.
Staff costs decreased by 14% over the year, or by 20% at constant
exchange rates, due to headcount reductions and business
divestments, notably Linea Directa and Tesco Personal Finance. Lower
depreciation charges followed the 2008 sale of the Angel Trains
business.
Third party assets, excluding derivatives, decreased by £56.9 billion in
the year as the division has run down exposures and pursued
opportunities to dispose of loan portfolios. Sales of equity stakes,
including Bank of China, were concluded while further disposals
announced in 2009, including Asian retail and commercial operations,
are moving towards completion in 2010.
Risk weighted assets increased by 0.2% in 2009, and at constant
exchange rates increased by 3%. The reduction of 15% since 30
September 2009, reflects active management to reduce trading book
exposures, largely offset by the impact of procyclicality, monoline
downgrades and adverse market risk.