RBS 2009 Annual Report Download - page 206
Download and view the complete annual report
Please find page 206 of the 2009 RBS annual report below. You can navigate through the pages in the report by either clicking on the pages listed below, or by using the keyword search tool below to find specific information within the annual report.-
 1
1 -
2
-
3
-
4
-
5
-
6
-
7
-
8
-
9
-
10
-
11
-
12
-
13
-
14
-
15
-
16
-
17
-
18
-
19
-
20
-
21
-
22
-
23
-
24
-
25
-
26
-
27
-
28
-
29
-
30
-
31
-
32
-
33
-
34
-
35
-
36
-
37
-
38
-
39
-
40
-
41
-
42
-
43
-
44
-
45
-
46
-
47
-
48
-
49
-
50
-
51
-
52
-
53
-
54
-
55
-
56
-
57
-
58
-
59
-
60
-
61
-
62
-
63
-
64
-
65
-
66
-
67
-
68
-
69
-
70
-
71
-
72
-
73
-
74
-
75
-
76
-
77
-
78
-
79
-
80
-
81
-
82
-
83
-
84
-
85
-
86
-
87
-
88
-
89
-
90
-
91
-
92
-
93
-
94
-
95
-
96
-
97
-
98
-
99
-
100
-
101
-
102
-
103
-
104
-
105
-
106
-
107
-
108
-
109
-
110
-
111
-
112
-
113
-
114
-
115
-
116
-
117
-
118
-
119
-
120
-
121
-
122
-
123
-
124
-
125
-
126
-
127
-
128
-
129
-
130
-
131
-
132
-
133
-
134
-
135
-
136
-
137
-
138
-
139
-
140
-
141
-
142
-
143
-
144
-
145
-
146
-
147
-
148
-
149
-
150
-
151
-
152
-
153
-
154
-
155
-
156
-
157
-
158
-
159
-
160
-
161
-
162
-
163
-
164
-
165
-
166
-
167
-
168
-
169
-
170
-
171
-
172
-
173
-
174
-
175
-
176
-
177
-
178
-
179
-
180
-
181
-
182
-
183
-
184
-
185
-
186
-
187
-
188
-
189
-
190
-
191
-
192
-
193
-
194
-
195
-
 196
196 -
 197
197 -
 198
198 -
 199
199 -
 200
200 -
 201
201 -
 202
202 -
 203
203 -
 204
204 -
 205
205 -
 206
206 -
 207
207 -
 208
208 -
 209
209 -
 210
210 -
 211
211 -
 212
212 -
 213
213 -
 214
214 -
 215
215 -
 216
216 -
217
-
218
-
219
-
220
-
221
-
222
-
223
-
224
-
225
-
226
-
227
-
228
-
229
-
230
-
231
-
232
-
233
-
234
-
235
-
236
-
237
-
238
-
239
-
240
-
241
-
242
-
243
-
244
-
245
-
246
-
247
-
248
-
249
-
250
-
251
-
252
-
253
-
254
-
255
-
256
-
257
-
258
-
259
-
260
-
261
-
262
-
263
-
264
-
265
-
266
-
267
-
268
-
269
-
270
-
271
-
272
-
273
-
274
-
275
-
276
-
277
-
278
-
279
-
280
-
281
-
282
-
283
-
284
-
285
-
286
-
287
-
288
-
289
-
290
-
291
-
292
-
293
-
294
-
295
-
296
-
297
-
298
-
299
-
300
-
301
-
302
-
303
-
304
-
305
-
306
-
307
-
308
-
309
-
310
-
311
-
312
-
313
-
314
-
315
-
316
-
317
-
318
-
319
-
320
-
321
-
322
-
323
-
324
-
325
-
326
-
327
-
328
-
329
-
330
-
331
-
332
-
333
-
334
-
335
-
336
-
337
-
338
-
339
-
340
-
341
-
342
-
343
-
344
-
345
-
346
-
347
-
348
-
349
-
350
-
351
-
352
-
353
-
354
-
355
-
356
-
357
-
358
-
359
-
360
-
361
-
362
-
363
-
364
-
365
-
366
-
367
-
368
-
369
-
370
-
371
-
372
-
373
-
374
-
375
-
376
-
377
-
378
-
379
-
380
-
381
-
382
-
383
-
384
-
385
-
386
-
387
-
388
-
389
-
390
 |
 |

Business review continued
RBS Group Annual Report and Accounts 2009204
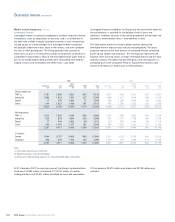
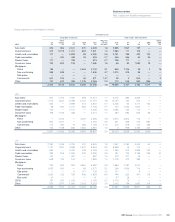
Market turmoil exposures continued
Special purpose entities continued
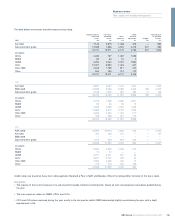
During the period both multi-seller and own asset conduit assets have been reduced in line with the wider Group balance sheet management.
Collateral analysis, profile, credit ratings and weighted average lives relating to the Group’s consolidated conduits are detailed below.
Funded assets Liquidity for Total
Loan Securities Total Undrawn third parties exposure
2009 £m £m £m £m £m £m
Auto loans 4,293 356 4,649 2,526 — 7,175
Corporate loans 106 7,695 7,801 161 — 7,962
Credit card receivables 4,083 — 4,083 1,058 — 5,141
Trade receivables 806 — 806 1,351 — 2,157
Student loans 915 — 915 263 (132) 1,046
Consumer loans 1,686 — 1,686 222 — 1,908
Mortgages:
Prime 2,739 3 2,742 750 — 3,492
Non-conforming 1,548 — 1,548 193 — 1,741
Commercial 413 458 871 155 (22) 1,004
Other 872 1,393 2,265 232 (12) 2,485
17,461 9,905 27,366 6,911 (166) 34,111
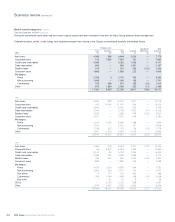
2008
Auto loans 9,924 383 10,307 1,871 — 12,178
Corporate loans 430 11,042 11,472 534 — 12,006
Credit card receivables 5,844 — 5,844 922 — 6,766
Trade receivables 2,745 — 2,745 1,432 (71) 4,106
Student loans 2,555 — 2,555 478 (132) 2,901
Consumer loans 2,371 — 2,371 409 — 2,780
Mortgages:
Prime 4,416 2,250 6,666 1,188 — 7,854
Non-conforming 2,181 — 2,181 727 — 2,908
Commercial 1,228 507 1,735 66 (23) 1,778
Other 1,851 2,130 3,981 1,615 — 5,596
33,545 16,312 49,857 9,242 (226) 58,873
2007
Auto loans 8,066 578 8,644 3,701 (102) 12,243
Corporate loans 36 8,927 8,963 1,390 — 10,353
Credit card receivables 5,104 90 5,194 1,206 — 6,400
Trade receivables 3,068 320 3,388 2,386 — 5,774
Student loans 335 262 597 1,082 (132) 1,547
Consumer loans 1,886 — 1,886 403 — 2,289
Mortgages:
Prime 4,424 2,263 6,687 664 — 7,351
Non-conforming 2,343 234 2,577 740 — 3,317
Sub-prime 9 117 126 363 — 489
Commercial 799 1,094 1,893 168 (23) 2,038
Buy-to-let — 61 61 8 — 69
CDOs — 2,129 2,129 268 — 2,397
Other 2,976 2,947 5,923 2,433 — 8,356
29,046 19,022 48,068 14,812 (257) 62,623