RBS 2009 Annual Report Download - page 200
Download and view the complete annual report
Please find page 200 of the 2009 RBS annual report below. You can navigate through the pages in the report by either clicking on the pages listed below, or by using the keyword search tool below to find specific information within the annual report.-
 1
1 -
2
-
3
-
4
-
5
-
6
-
7
-
8
-
9
-
10
-
11
-
12
-
13
-
14
-
15
-
16
-
17
-
18
-
19
-
20
-
21
-
22
-
23
-
24
-
25
-
26
-
27
-
28
-
29
-
30
-
31
-
32
-
33
-
34
-
35
-
36
-
37
-
38
-
39
-
40
-
41
-
42
-
43
-
44
-
45
-
46
-
47
-
48
-
49
-
50
-
51
-
52
-
53
-
54
-
55
-
56
-
57
-
58
-
59
-
60
-
61
-
62
-
63
-
64
-
65
-
66
-
67
-
68
-
69
-
70
-
71
-
72
-
73
-
74
-
75
-
76
-
77
-
78
-
79
-
80
-
81
-
82
-
83
-
84
-
85
-
86
-
87
-
88
-
89
-
90
-
91
-
92
-
93
-
94
-
95
-
96
-
97
-
98
-
99
-
100
-
101
-
102
-
103
-
104
-
105
-
106
-
107
-
108
-
109
-
110
-
111
-
112
-
113
-
114
-
115
-
116
-
117
-
118
-
119
-
120
-
121
-
122
-
123
-
124
-
125
-
126
-
127
-
128
-
129
-
130
-
131
-
132
-
133
-
134
-
135
-
136
-
137
-
138
-
139
-
140
-
141
-
142
-
143
-
144
-
145
-
146
-
147
-
148
-
149
-
150
-
151
-
152
-
153
-
154
-
155
-
156
-
157
-
158
-
159
-
160
-
161
-
162
-
163
-
164
-
165
-
166
-
167
-
168
-
169
-
170
-
171
-
172
-
173
-
174
-
175
-
176
-
177
-
178
-
179
-
180
-
181
-
182
-
183
-
184
-
185
-
186
-
187
-
188
-
189
-
 190
190 -
 191
191 -
 192
192 -
 193
193 -
 194
194 -
 195
195 -
 196
196 -
 197
197 -
 198
198 -
 199
199 -
 200
200 -
 201
201 -
 202
202 -
 203
203 -
 204
204 -
 205
205 -
 206
206 -
 207
207 -
 208
208 -
 209
209 -
 210
210 -
211
-
212
-
213
-
214
-
215
-
216
-
217
-
218
-
219
-
220
-
221
-
222
-
223
-
224
-
225
-
226
-
227
-
228
-
229
-
230
-
231
-
232
-
233
-
234
-
235
-
236
-
237
-
238
-
239
-
240
-
241
-
242
-
243
-
244
-
245
-
246
-
247
-
248
-
249
-
250
-
251
-
252
-
253
-
254
-
255
-
256
-
257
-
258
-
259
-
260
-
261
-
262
-
263
-
264
-
265
-
266
-
267
-
268
-
269
-
270
-
271
-
272
-
273
-
274
-
275
-
276
-
277
-
278
-
279
-
280
-
281
-
282
-
283
-
284
-
285
-
286
-
287
-
288
-
289
-
290
-
291
-
292
-
293
-
294
-
295
-
296
-
297
-
298
-
299
-
300
-
301
-
302
-
303
-
304
-
305
-
306
-
307
-
308
-
309
-
310
-
311
-
312
-
313
-
314
-
315
-
316
-
317
-
318
-
319
-
320
-
321
-
322
-
323
-
324
-
325
-
326
-
327
-
328
-
329
-
330
-
331
-
332
-
333
-
334
-
335
-
336
-
337
-
338
-
339
-
340
-
341
-
342
-
343
-
344
-
345
-
346
-
347
-
348
-
349
-
350
-
351
-
352
-
353
-
354
-
355
-
356
-
357
-
358
-
359
-
360
-
361
-
362
-
363
-
364
-
365
-
366
-
367
-
368
-
369
-
370
-
371
-
372
-
373
-
374
-
375
-
376
-
377
-
378
-
379
-
380
-
381
-
382
-
383
-
384
-
385
-
386
-
387
-
388
-
389
-
390
 |
 |

Business review continued
RBS Group Annual Report and Accounts 2009198
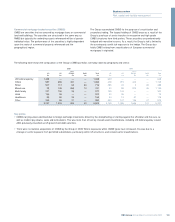
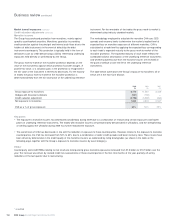
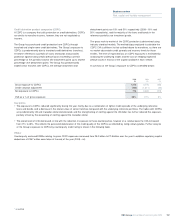
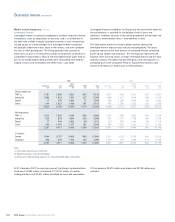
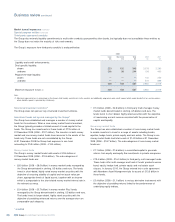
The net income statement effect arising from CDPC exposures is shown in the table below.
Market turmoil exposures continued
Credit valuation adjustments continued
Credit derivative product companies (CDPC) continued
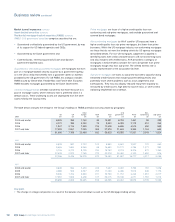
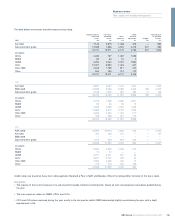
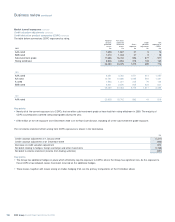
The table below summarises CDPC exposures by rating.
Notional Fair value:
amount: protected Credit Net
protected reference Gross valuation exposure to
assets assets exposure adjustment CDPCs
2009 £m £m £m £m £m
AAA rated 1,658 1,637 21 5 16
BBB rated 1,070 1,043 27 9 18
Sub-investment grade 17,696 16,742 954 377 577
Rating withdrawn 3,926 3,653 273 108 165
24,350 23,075 1,275 499 776
2008
AAA rated 6,351 4,780 1,571 314 1,257
AA rated 12,741 10,686 2,055 594 1,461
A rated 1,546 1,321 225 79 146
BBB rated 4,601 3,676 925 324 601
25,239 20,463 4,776 1,311 3,465
2007
AAA rated 20,605 19,742 863 44 819
Key points
•Nearly all of the current exposure is to CDPCs that are either sub-investment grade or have had their rating withdrawn in 2009. The majority of
CDPC counterparties suffered rating downgrades during the year.
•£750 million of the net exposure at 31 December 2009 is in the Non-Core division, including all of the sub-investment grade exposure.
£m
Credit valuation adjustment at 1 January 2009 (1,311)
Credit valuation adjustment at 31 December 2009 (499)
Decrease in credit valuation adjustment 812
Net debit relating to hedges, foreign exchange and other movements (1,769)
Net debit to income statement (income from trading activities) (957)
Key points
•The Group has additional hedges in place which effectively cap the exposure to CDPCs where the Group has significant risk. As the exposure to
these CDPCs has reduced, losses have been incurred on the additional hedges.
•These losses, together with losses arising on trades hedging CVA, are the primary components of the £1.8 billion above.