RBS 2009 Annual Report Download - page 167
Download and view the complete annual report
Please find page 167 of the 2009 RBS annual report below. You can navigate through the pages in the report by either clicking on the pages listed below, or by using the keyword search tool below to find specific information within the annual report.-
 1
1 -
2
-
3
-
4
-
5
-
6
-
7
-
8
-
9
-
10
-
11
-
12
-
13
-
14
-
15
-
16
-
17
-
18
-
19
-
20
-
21
-
22
-
23
-
24
-
25
-
26
-
27
-
28
-
29
-
30
-
31
-
32
-
33
-
34
-
35
-
36
-
37
-
38
-
39
-
40
-
41
-
42
-
43
-
44
-
45
-
46
-
47
-
48
-
49
-
50
-
51
-
52
-
53
-
54
-
55
-
56
-
57
-
58
-
59
-
60
-
61
-
62
-
63
-
64
-
65
-
66
-
67
-
68
-
69
-
70
-
71
-
72
-
73
-
74
-
75
-
76
-
77
-
78
-
79
-
80
-
81
-
82
-
83
-
84
-
85
-
86
-
87
-
88
-
89
-
90
-
91
-
92
-
93
-
94
-
95
-
96
-
97
-
98
-
99
-
100
-
101
-
102
-
103
-
104
-
105
-
106
-
107
-
108
-
109
-
110
-
111
-
112
-
113
-
114
-
115
-
116
-
117
-
118
-
119
-
120
-
121
-
122
-
123
-
124
-
125
-
126
-
127
-
128
-
129
-
130
-
131
-
132
-
133
-
134
-
135
-
136
-
137
-
138
-
139
-
140
-
141
-
142
-
143
-
144
-
145
-
146
-
147
-
148
-
149
-
150
-
151
-
152
-
153
-
154
-
155
-
156
-
 157
157 -
 158
158 -
 159
159 -
 160
160 -
 161
161 -
 162
162 -
 163
163 -
 164
164 -
 165
165 -
 166
166 -
 167
167 -
 168
168 -
 169
169 -
 170
170 -
 171
171 -
 172
172 -
 173
173 -
 174
174 -
 175
175 -
 176
176 -
 177
177 -
178
-
179
-
180
-
181
-
182
-
183
-
184
-
185
-
186
-
187
-
188
-
189
-
190
-
191
-
192
-
193
-
194
-
195
-
196
-
197
-
198
-
199
-
200
-
201
-
202
-
203
-
204
-
205
-
206
-
207
-
208
-
209
-
210
-
211
-
212
-
213
-
214
-
215
-
216
-
217
-
218
-
219
-
220
-
221
-
222
-
223
-
224
-
225
-
226
-
227
-
228
-
229
-
230
-
231
-
232
-
233
-
234
-
235
-
236
-
237
-
238
-
239
-
240
-
241
-
242
-
243
-
244
-
245
-
246
-
247
-
248
-
249
-
250
-
251
-
252
-
253
-
254
-
255
-
256
-
257
-
258
-
259
-
260
-
261
-
262
-
263
-
264
-
265
-
266
-
267
-
268
-
269
-
270
-
271
-
272
-
273
-
274
-
275
-
276
-
277
-
278
-
279
-
280
-
281
-
282
-
283
-
284
-
285
-
286
-
287
-
288
-
289
-
290
-
291
-
292
-
293
-
294
-
295
-
296
-
297
-
298
-
299
-
300
-
301
-
302
-
303
-
304
-
305
-
306
-
307
-
308
-
309
-
310
-
311
-
312
-
313
-
314
-
315
-
316
-
317
-
318
-
319
-
320
-
321
-
322
-
323
-
324
-
325
-
326
-
327
-
328
-
329
-
330
-
331
-
332
-
333
-
334
-
335
-
336
-
337
-
338
-
339
-
340
-
341
-
342
-
343
-
344
-
345
-
346
-
347
-
348
-
349
-
350
-
351
-
352
-
353
-
354
-
355
-
356
-
357
-
358
-
359
-
360
-
361
-
362
-
363
-
364
-
365
-
366
-
367
-
368
-
369
-
370
-
371
-
372
-
373
-
374
-
375
-
376
-
377
-
378
-
379
-
380
-
381
-
382
-
383
-
384
-
385
-
386
-
387
-
388
-
389
-
390
 |
 |

Business review
Risk, capital and liquidity management
165RBS Group Annual Report and Accounts 2009
Various banking regulators review non-trading market risks as part of
their regulatory oversight. As home country regulator, the FSA has
responsibility for reviewing non-trading market risk at a Group
consolidated level.
The Group is exposed to the following non-traded risks:
Interest Rate Risk in the Banking Book (IRRBB) represents exposures to
instruments whose values vary with the level or volatility of interest rates.
These instruments include, but are not limited to, loans, debt securities,
equity shares, deposits, certificates of deposits, loan capital and
derivatives. Hedging instruments used to mitigate these risks include
related derivatives such as options, futures, forwards and swaps.
Interest rate risk arises from the Group’s non-trading activities in four
principal forms:
•Re-pricing risk – arises from differences in the re-pricing terms of the
Group’s assets and liabilities;
•Optionality – arises where a customer has an option to exit a deal early;
•Basis risk – arises, for example where liabilities, the interest on which
is linked to LIBOR, is used to fund assets bearing interest linked to
the base rate; and
•Yield curve risk – arises as a result of non-parallel changes in the
yield curve.
It is the Group’s policy to minimise the sensitivity to changes in interest
rates in its retail and commercial businesses and, where interest rate
risk is retained, to ensure that appropriate resources, measures and
limits are applied.
Non-trading interest rate risk is calculated in each business on the basis
of establishing the re-pricing behaviour of each asset, liability and off-
balance sheet product. For many retail and commercial products, the
actual interest rate re-pricing characteristics differ from the contractual
re-pricing. In most cases, the re-pricing maturity is determined by the
market interest rate that most closely fits the historical behaviour of the
product interest rate. For non-interest bearing current accounts, the re-
pricing maturity is determined by the stability of the portfolio. The re-
pricing maturities used are approved by Group Treasury and divisional
asset and liability committees at least annually. Key conventions are
reviewed annually by GALCO.
Non-trading interest rate exposures are controlled by limiting repricing
mismatches in the individual business balance sheets. Potential
exposures to interest rate movements in the medium to long- term are
measured and controlled using a version of the same VaR methodology
that is used for the Group’s trading portfolios. Net accrual income
exposures are measured and controlled in terms of sensitivity over time
to movements in interest rates.
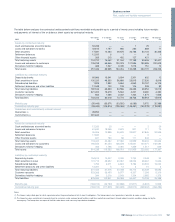
Risk is managed within VaR limits approved by GALCO, through the
execution of cash and derivative instruments (see Note 13 on the
accounts, on page 294). Execution of the hedging is carried out by the
relevant division through the Group’s treasury functions. The residual
risk position is reported to divisional asset and liability committees,
GALCO and the Board.
Foreign Exchange Risk in the Banking Book (FXRBB) represents
exposures to changes in the values of current holdings and future cash
flows denominated in other currencies. Hedging instruments used to
mitigate these risks include foreign currency options, currency swaps,
futures, forwards and deposits. Foreign exchange risk results from the
Group’s investments in overseas subsidiaries, associates and branches
in three principal forms:
•Structural foreign currency exposures that arise from net investment
in overseas subsidiaries, associates and branches;
•Transactional/commercial foreign currency exposures that arise from
mismatches in the currency balance sheet; and
•Foreign currency profit streams.
Equity Risk in the Banking Book (ERBB) is defined as the potential
variation in the Group’s non-trading income and reserves arising from
changes in equity prices/income. This risk may crystallise during the
course of normal business activities or in stressed market conditions.
Equity positions in the Group’s banking book are retained to achieve
strategic objectives, support venture capital transactions or in respect
of customer restructuring arrangements.
The commercial decision to invest in equity holdings, including customer
restructurings, is taken by authorised persons with delegated authority
under the Group credit approval framework. Investments or disposals of
a strategic nature are referred to the Group Acquisitions and Disposal
Committee (ADCo), Group Executive Committee (ExCo) and where
appropriate the Board for approval; those involving the purchase or sale
by the Group of subsidiary companies also require Board approval,
after consideration by ExCo and ADCo.
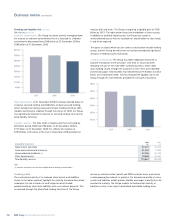
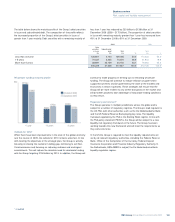
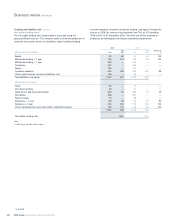
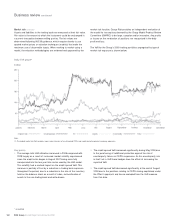
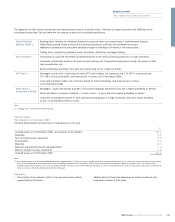
Structural interest rate risk
Non-trading interest rate VaR for the Group’s retail and commercial
banking activities at a 99% confidence level was £101.3 million at 31
December 2009 (2008 – £76.7 million). During 2009, the maximum VaR
was £123.2 million (2008 – £197.4 million), the minimum was £53.3
million (2008 – £76.7 million) and the average was £85.5 million (2008 –
£130.0 million).
A breakdown of the Group’s non-trading VaR (including RFS Holdings
minority interests) by currency is shown below.
2009 2008
£m £m
EUR 32.2 30.9
GBP 111.2 26.0
USD 42.1 57.9
Other 9.0 14.0
At year end the GBP VaR was increased by the impact of the B share issuance.