RBS 2009 Annual Report Download - page 179
Download and view the complete annual report
Please find page 179 of the 2009 RBS annual report below. You can navigate through the pages in the report by either clicking on the pages listed below, or by using the keyword search tool below to find specific information within the annual report.-
 1
1 -
2
-
3
-
4
-
5
-
6
-
7
-
8
-
9
-
10
-
11
-
12
-
13
-
14
-
15
-
16
-
17
-
18
-
19
-
20
-
21
-
22
-
23
-
24
-
25
-
26
-
27
-
28
-
29
-
30
-
31
-
32
-
33
-
34
-
35
-
36
-
37
-
38
-
39
-
40
-
41
-
42
-
43
-
44
-
45
-
46
-
47
-
48
-
49
-
50
-
51
-
52
-
53
-
54
-
55
-
56
-
57
-
58
-
59
-
60
-
61
-
62
-
63
-
64
-
65
-
66
-
67
-
68
-
69
-
70
-
71
-
72
-
73
-
74
-
75
-
76
-
77
-
78
-
79
-
80
-
81
-
82
-
83
-
84
-
85
-
86
-
87
-
88
-
89
-
90
-
91
-
92
-
93
-
94
-
95
-
96
-
97
-
98
-
99
-
100
-
101
-
102
-
103
-
104
-
105
-
106
-
107
-
108
-
109
-
110
-
111
-
112
-
113
-
114
-
115
-
116
-
117
-
118
-
119
-
120
-
121
-
122
-
123
-
124
-
125
-
126
-
127
-
128
-
129
-
130
-
131
-
132
-
133
-
134
-
135
-
136
-
137
-
138
-
139
-
140
-
141
-
142
-
143
-
144
-
145
-
146
-
147
-
148
-
149
-
150
-
151
-
152
-
153
-
154
-
155
-
156
-
157
-
158
-
159
-
160
-
161
-
162
-
163
-
164
-
165
-
166
-
167
-
168
-
 169
169 -
 170
170 -
 171
171 -
 172
172 -
 173
173 -
 174
174 -
 175
175 -
 176
176 -
 177
177 -
 178
178 -
 179
179 -
 180
180 -
 181
181 -
 182
182 -
 183
183 -
 184
184 -
 185
185 -
 186
186 -
 187
187 -
 188
188 -
 189
189 -
190
-
191
-
192
-
193
-
194
-
195
-
196
-
197
-
198
-
199
-
200
-
201
-
202
-
203
-
204
-
205
-
206
-
207
-
208
-
209
-
210
-
211
-
212
-
213
-
214
-
215
-
216
-
217
-
218
-
219
-
220
-
221
-
222
-
223
-
224
-
225
-
226
-
227
-
228
-
229
-
230
-
231
-
232
-
233
-
234
-
235
-
236
-
237
-
238
-
239
-
240
-
241
-
242
-
243
-
244
-
245
-
246
-
247
-
248
-
249
-
250
-
251
-
252
-
253
-
254
-
255
-
256
-
257
-
258
-
259
-
260
-
261
-
262
-
263
-
264
-
265
-
266
-
267
-
268
-
269
-
270
-
271
-
272
-
273
-
274
-
275
-
276
-
277
-
278
-
279
-
280
-
281
-
282
-
283
-
284
-
285
-
286
-
287
-
288
-
289
-
290
-
291
-
292
-
293
-
294
-
295
-
296
-
297
-
298
-
299
-
300
-
301
-
302
-
303
-
304
-
305
-
306
-
307
-
308
-
309
-
310
-
311
-
312
-
313
-
314
-
315
-
316
-
317
-
318
-
319
-
320
-
321
-
322
-
323
-
324
-
325
-
326
-
327
-
328
-
329
-
330
-
331
-
332
-
333
-
334
-
335
-
336
-
337
-
338
-
339
-
340
-
341
-
342
-
343
-
344
-
345
-
346
-
347
-
348
-
349
-
350
-
351
-
352
-
353
-
354
-
355
-
356
-
357
-
358
-
359
-
360
-
361
-
362
-
363
-
364
-
365
-
366
-
367
-
368
-
369
-
370
-
371
-
372
-
373
-
374
-
375
-
376
-
377
-
378
-
379
-
380
-
381
-
382
-
383
-
384
-
385
-
386
-
387
-
388
-
389
-
390
 |
 |

Business review
Risk, capital and liquidity management
177RBS Group Annual Report and Accounts 2009
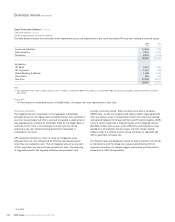
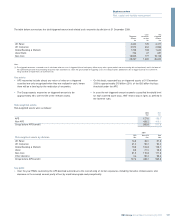
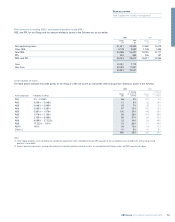
The table below summarises the total triggered amount and related cash recoveries by division at 31 December 2009.
Cash Net
Triggered recoveries triggered
amount to date amount
£m £m £m
UK Retail 3,340 129 3,211
UK Corporate 3,570 604 2,966
Global Banking & Markets 1,748 108 1,640
Ulster Bank 704 47 657
Non-Core 18,905 777 18,128
28,267 1,665 26,602
Note:
(1) The triggered amount on a covered asset is calculated when an asset is triggered (due to bankruptcy, failure to pay after a grace period, and restructuring with an impairment) and is the lower of
the covered amount and the outstanding amount for each covered asset. Given the grace period for triggering assets, the Group expects additional assets to trigger based on the current risk
rating and level of impairments on covered assets.
Key points
•APS recoveries include almost any return of value on a triggered
asset but are only recognised when they are realised in cash, hence
there will be a time lag for the realisation of recoveries.
•The Group expects recoveries on triggered amounts to be
approximately 45% over the life of the relevant assets.
•On this basis, expected loss on triggered assets at 31 December
2009 is approximately £15 billion (25%) of the £60 billion first loss
threshold under the APS.
•In case the net triggered amount exceeds a specified threshold level
for each covered asset class, HMT retains step-in rights as defined in
the Scheme rules.
Risk-weighted assets
Risk-weighted assets were as follows:
2009 2008
£bn £bn
APS 127.6 158.7
Non-APS 438.2 419.1
Group before APS benefit 565.8 577.8
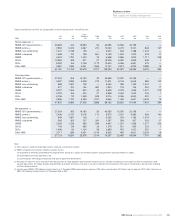
2009
APS Non-APS Total
Risk-weighted assets by division £bn £bn £bn
UK Retail 16.3 35.0 51.3
UK Corporate 31.0 59.2 90.2
Global Banking & Markets 19.9 103.8 123.7
Ulster 8.9 21.0 29.9
Non-Core 51.5 119.8 171.3
Other divisions n/a 99.4 99.4
Group before APS benefit 127.6 438.2 565.8
Key point
•Over the year RWAs covered by the APS declined overall due to the restructuring of certain exposures, including monoline related assets, and
decrease in the covered amount partly off-set by credit downgrade and procyclicality.