RBS 2009 Annual Report Download - page 294
Download and view the complete annual report
Please find page 294 of the 2009 RBS annual report below. You can navigate through the pages in the report by either clicking on the pages listed below, or by using the keyword search tool below to find specific information within the annual report.-
 1
1 -
2
-
3
-
4
-
5
-
6
-
7
-
8
-
9
-
10
-
11
-
12
-
13
-
14
-
15
-
16
-
17
-
18
-
19
-
20
-
21
-
22
-
23
-
24
-
25
-
26
-
27
-
28
-
29
-
30
-
31
-
32
-
33
-
34
-
35
-
36
-
37
-
38
-
39
-
40
-
41
-
42
-
43
-
44
-
45
-
46
-
47
-
48
-
49
-
50
-
51
-
52
-
53
-
54
-
55
-
56
-
57
-
58
-
59
-
60
-
61
-
62
-
63
-
64
-
65
-
66
-
67
-
68
-
69
-
70
-
71
-
72
-
73
-
74
-
75
-
76
-
77
-
78
-
79
-
80
-
81
-
82
-
83
-
84
-
85
-
86
-
87
-
88
-
89
-
90
-
91
-
92
-
93
-
94
-
95
-
96
-
97
-
98
-
99
-
100
-
101
-
102
-
103
-
104
-
105
-
106
-
107
-
108
-
109
-
110
-
111
-
112
-
113
-
114
-
115
-
116
-
117
-
118
-
119
-
120
-
121
-
122
-
123
-
124
-
125
-
126
-
127
-
128
-
129
-
130
-
131
-
132
-
133
-
134
-
135
-
136
-
137
-
138
-
139
-
140
-
141
-
142
-
143
-
144
-
145
-
146
-
147
-
148
-
149
-
150
-
151
-
152
-
153
-
154
-
155
-
156
-
157
-
158
-
159
-
160
-
161
-
162
-
163
-
164
-
165
-
166
-
167
-
168
-
169
-
170
-
171
-
172
-
173
-
174
-
175
-
176
-
177
-
178
-
179
-
180
-
181
-
182
-
183
-
184
-
185
-
186
-
187
-
188
-
189
-
190
-
191
-
192
-
193
-
194
-
195
-
196
-
197
-
198
-
199
-
200
-
201
-
202
-
203
-
204
-
205
-
206
-
207
-
208
-
209
-
210
-
211
-
212
-
213
-
214
-
215
-
216
-
217
-
218
-
219
-
220
-
221
-
222
-
223
-
224
-
225
-
226
-
227
-
228
-
229
-
230
-
231
-
232
-
233
-
234
-
235
-
236
-
237
-
238
-
239
-
240
-
241
-
242
-
243
-
244
-
245
-
246
-
247
-
248
-
249
-
250
-
251
-
252
-
253
-
254
-
255
-
256
-
257
-
258
-
259
-
260
-
261
-
262
-
263
-
264
-
265
-
266
-
267
-
268
-
269
-
270
-
271
-
272
-
273
-
274
-
275
-
276
-
277
-
278
-
279
-
280
-
281
-
282
-
283
-
 284
284 -
 285
285 -
 286
286 -
 287
287 -
 288
288 -
 289
289 -
 290
290 -
 291
291 -
 292
292 -
 293
293 -
 294
294 -
 295
295 -
 296
296 -
 297
297 -
 298
298 -
 299
299 -
 300
300 -
 301
301 -
 302
302 -
 303
303 -
 304
304 -
305
-
306
-
307
-
308
-
309
-
310
-
311
-
312
-
313
-
314
-
315
-
316
-
317
-
318
-
319
-
320
-
321
-
322
-
323
-
324
-
325
-
326
-
327
-
328
-
329
-
330
-
331
-
332
-
333
-
334
-
335
-
336
-
337
-
338
-
339
-
340
-
341
-
342
-
343
-
344
-
345
-
346
-
347
-
348
-
349
-
350
-
351
-
352
-
353
-
354
-
355
-
356
-
357
-
358
-
359
-
360
-
361
-
362
-
363
-
364
-
365
-
366
-
367
-
368
-
369
-
370
-
371
-
372
-
373
-
374
-
375
-
376
-
377
-
378
-
379
-
380
-
381
-
382
-
383
-
384
-
385
-
386
-
387
-
388
-
389
-
390
 |
 |

Notes on the accounts continued
RBS Group Annual Report and Accounts 2009292
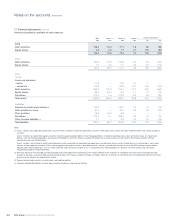
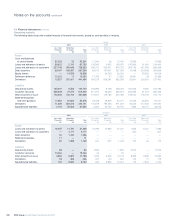
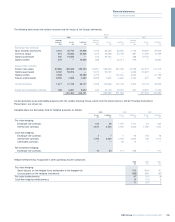
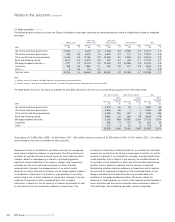
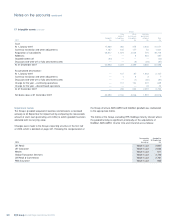
12 Financial assets – impairments
The following table shows the movement in the provision for impairment losses for loans and advances.
Group
Individually Collectively Total
assessed assessed Latent 2009 2008 2007
£m £m £m £m £m £m
At 1 January 4,970 4,102 1,944 11,016 6,452 3,935
Transfer to disposal groups (155) (111) (58) (324) (767) —
Currency translation and other adjustments (330) (78) (122) (530) 1,441 137
Acquisition of subsidiaries ————— 2,221
Disposal of subsidiaries (65) — — (65) (178) —
Net increase in provisions of discontinued operations —————46
Amounts written-off (3,940) (2,999) — (6,939) (3,148) (2,011)
Recoveries of amounts previously written-off 94 305 — 399 319 342
Charged to the income statement 8,625 4,197 1,312 14,134 7,091 1,946
Unwind of discount (246) (162) — (408) (194) (164)
At 31 December (1) 8,953 5,254 3,076 17,283 11,016 6,452
Notes:
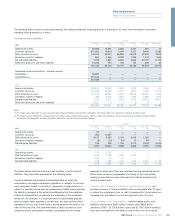
(1) The provision for impairment losses at 31 December 2009 includes £157 million relating to loans and advances to banks (2008 – £127 million; 2007 – £3 million).
(2) There is no provision for impairment losses in the company.
Group
2009 2008 2007
Impairment losses charged to the income statement £m £m £m
Loans and advances to customers 14,100 6,973 1,946
Loans and advances to banks 34 118 —
14,134 7,091 1,946
Debt securities 601 878 20
Equity shares 215 103 2
816 981 22
14,950 8,072 1,968
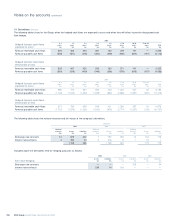
Group
2009 2008 2007
£m £m £m
Gross income not recognised but which would have been recognised under the
original terms of non-accrual and restructured loans
Domestic 625 393 390
Foreign 1,079 342 155
1,704 735 545
Interest on non-accrual and restructured loans included in net interest income
Domestic 226 150 165
Foreign 182 43 16
408 193 181