RBS 2009 Annual Report Download - page 377
Download and view the complete annual report
Please find page 377 of the 2009 RBS annual report below. You can navigate through the pages in the report by either clicking on the pages listed below, or by using the keyword search tool below to find specific information within the annual report.-
 1
1 -
2
-
3
-
4
-
5
-
6
-
7
-
8
-
9
-
10
-
11
-
12
-
13
-
14
-
15
-
16
-
17
-
18
-
19
-
20
-
21
-
22
-
23
-
24
-
25
-
26
-
27
-
28
-
29
-
30
-
31
-
32
-
33
-
34
-
35
-
36
-
37
-
38
-
39
-
40
-
41
-
42
-
43
-
44
-
45
-
46
-
47
-
48
-
49
-
50
-
51
-
52
-
53
-
54
-
55
-
56
-
57
-
58
-
59
-
60
-
61
-
62
-
63
-
64
-
65
-
66
-
67
-
68
-
69
-
70
-
71
-
72
-
73
-
74
-
75
-
76
-
77
-
78
-
79
-
80
-
81
-
82
-
83
-
84
-
85
-
86
-
87
-
88
-
89
-
90
-
91
-
92
-
93
-
94
-
95
-
96
-
97
-
98
-
99
-
100
-
101
-
102
-
103
-
104
-
105
-
106
-
107
-
108
-
109
-
110
-
111
-
112
-
113
-
114
-
115
-
116
-
117
-
118
-
119
-
120
-
121
-
122
-
123
-
124
-
125
-
126
-
127
-
128
-
129
-
130
-
131
-
132
-
133
-
134
-
135
-
136
-
137
-
138
-
139
-
140
-
141
-
142
-
143
-
144
-
145
-
146
-
147
-
148
-
149
-
150
-
151
-
152
-
153
-
154
-
155
-
156
-
157
-
158
-
159
-
160
-
161
-
162
-
163
-
164
-
165
-
166
-
167
-
168
-
169
-
170
-
171
-
172
-
173
-
174
-
175
-
176
-
177
-
178
-
179
-
180
-
181
-
182
-
183
-
184
-
185
-
186
-
187
-
188
-
189
-
190
-
191
-
192
-
193
-
194
-
195
-
196
-
197
-
198
-
199
-
200
-
201
-
202
-
203
-
204
-
205
-
206
-
207
-
208
-
209
-
210
-
211
-
212
-
213
-
214
-
215
-
216
-
217
-
218
-
219
-
220
-
221
-
222
-
223
-
224
-
225
-
226
-
227
-
228
-
229
-
230
-
231
-
232
-
233
-
234
-
235
-
236
-
237
-
238
-
239
-
240
-
241
-
242
-
243
-
244
-
245
-
246
-
247
-
248
-
249
-
250
-
251
-
252
-
253
-
254
-
255
-
256
-
257
-
258
-
259
-
260
-
261
-
262
-
263
-
264
-
265
-
266
-
267
-
268
-
269
-
270
-
271
-
272
-
273
-
274
-
275
-
276
-
277
-
278
-
279
-
280
-
281
-
282
-
283
-
284
-
285
-
286
-
287
-
288
-
289
-
290
-
291
-
292
-
293
-
294
-
295
-
296
-
297
-
298
-
299
-
300
-
301
-
302
-
303
-
304
-
305
-
306
-
307
-
308
-
309
-
310
-
311
-
312
-
313
-
314
-
315
-
316
-
317
-
318
-
319
-
320
-
321
-
322
-
323
-
324
-
325
-
326
-
327
-
328
-
329
-
330
-
331
-
332
-
333
-
334
-
335
-
336
-
337
-
338
-
339
-
340
-
341
-
342
-
343
-
344
-
345
-
346
-
347
-
348
-
349
-
350
-
351
-
352
-
353
-
354
-
355
-
356
-
357
-
358
-
359
-
360
-
361
-
362
-
363
-
364
-
365
-
366
-
 367
367 -
 368
368 -
 369
369 -
 370
370 -
 371
371 -
 372
372 -
 373
373 -
 374
374 -
 375
375 -
 376
376 -
 377
377 -
 378
378 -
 379
379 -
 380
380 -
 381
381 -
 382
382 -
 383
383 -
 384
384 -
 385
385 -
 386
386 -
 387
387 -
388
-
389
-
390
 |
 |

Shareholder information
375RBS Group Annual Report and Accounts 2009
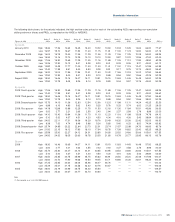
The following table shows, for the periods indicated, the high and low sales prices for each of the outstanding ADSs representing non-cumulative
dollar preference shares and PROs, as reported on the NYSE or NASDAQ:
Series F Series H Series L Series M Series N Series P Series Q Series R Series S Series T Series U
Figures in US$ ADSs ADSs ADSs ADSs ADSs ADSs ADSs ADSs ADSs ADSs ADSs PROs(1)
By month
January 2010 High 18.34 17.26 14.60 13.45 13.40 13.22 13.60 13.03 13.45 14.62 66.00 77.67
Low 16.57 15.10 13.67 11.50 11.40 11.15 11.81 11.02 11.73 12.90 54.00 67.13
December 2009 High 16.04 15.19 13.40 11.36 11.29 11.06 11.29 11.06 11.25 12.08 54.00 69.25
Low 15.34 14.16 12.70 10.25 10.10 10.10 10.53 9.87 10.22 10.96 47.00 62.00
November 2009 High 17.06 15.90 13.65 11.25 11.05 11.16 11.69 11.05 11.12 11.83 48.50 62.25
Low 13.26 12.80 10.13 8.41 8.38 8.20 8.41 8.33 8.36 9.21 43.00 60.12
October 2009 High 14.82 14.09 11.77 11.00 11.00 11.00 11.41 11.00 11.15 12.47 51.95 60.38
Low 12.40 11.59 9.51 9.40 9.50 9.28 9.91 9.17 9.75 10.73 45.00 55.62
September 2009 High 15.20 14.24 11.86 11.94 12.01 11.60 12.42 11.65 12.18 14.02 57.50 55.63
Low 12.50 10.84 9.00 9.41 9.30 9.10 9.69 8.94 9.50 10.66 42.25 52.25
August 2009 High 18.30 16.46 13.14 14.07 14.11 13.91 15.15 13.63 14.45 16.48 54.00 52.25
Low 12.50 10.79 9.08 9.26 9.14 9.19 9.80 9.04 9.57 10.75 43.00 50.25
By quarter
2009: Fourth quarter High 17.06 15.90 13.65 11.36 11.29 11.16 11.69 11.06 11.25 12.47 54.00 69.25
Low 12.40 11.59 9.51 8.41 8.38 8.20 8.41 8.33 8.36 9.21 43.00 55.62
2009: Third quarter High 18.30 16.46 13.14 14.07 14.11 13.91 15.15 13.63 14.45 16.48 57.50 55.63
Low 12.50 10.79 9.00 9.26 9.14 9.10 9.69 8.94 9.50 10.66 39.00 50.25
2009: Second quarter High 15.73 14.10 11.36 12.80 12.54 12.36 13.20 11.98 13.11 14.24 43.25 50.50
Low 6.99 6.13 4.90 5.62 5.40 5.25 5.76 5.25 5.74 6.00 21.25 28.00
2009: First quarter High 14.19 12.99 10.89 12.25 11.75 11.50 12.18 11.30 11.84 13.51 43.96 56.03
Low 3.00 2.77 2.21 2.63 2.55 2.43 2.64 2.37 2.58 2.78 8.98 20.00
2008: Fourth quarter High 14.10 13.40 10.94 11.36 11.70 11.10 12.20 11.16 11.98 13.09 74.78 84.10
Low 5.10 5.00 4.37 4.51 4.20 4.50 4.34 4.16 4.36 5.43 39.84 53.60
2008: Third quarter High 24.00 22.11 17.31 19.36 19.29 18.76 20.49 18.32 20.06 22.42 92.03 96.30
Low 8.39 7.00 4.74 8.49 5.98 5.24 5.80 5.40 6.25 8.00 74.34 83.82
2008: Second quarter High 25.74 24.95 20.22 22.64 22.73 22.01 23.74 21.57 22.99 24.73 96.63 93.76
Low 21.50 20.15 16.12 17.90 18.10 17.34 18.78 17.08 18.62 20.40 85.25 89.23
2008: First quarter High 25.59 25.30 22.27 24.12 24.01 23.85 24.95 23.52 24.66 25.66 105.61 107.55
Low 24.50 24.00 18.05 20.60 19.78 20.05 21.80 19.79 20.77 23.95 86.13 93.76
By year
2009 High 18.30 16.46 13.65 14.07 14.11 13.91 15.15 13.63 14.45 16.48 57.50 69.25
Low 3.00 2.77 2.21 2.63 2.55 2.43 2.64 2.37 2.58 2.78 8.98 20.00
2008 High 25.74 25.30 22.27 24.12 24.01 23.85 24.95 23.52 24.66 25.66 105.61 107.55
Low 5.10 5.00 4.37 4.51 4.20 4.50 4.34 4.16 4.36 5.43 39.84 53.60
2007 High 26.50 25.85 24.75 25.99 25.75 25.83 26.91 25.50 25.20 25.48 107.98 122.07
Low 23.60 22.70 17.90 19.68 19.50 19.25 20.71 18.96 20.26 22.61 98.34 100.49
2006 High 27.25 25.95 24.62 26.08 25.96 26.07 26.76 ————122.23
Low 25.29 25.01 21.15 23.58 23.32 22.76 24.67 ————106.06
2005 High 28.00 26.19 24.99 26.75 26.23 25.50 —————129.57
Low 26.02 25.20 22.67 24.77 24.70 24.60 —————116.70
Note:
(1) Price quoted as a % of US$1,000 nominal.