RBS 2009 Annual Report Download - page 133
Download and view the complete annual report
Please find page 133 of the 2009 RBS annual report below. You can navigate through the pages in the report by either clicking on the pages listed below, or by using the keyword search tool below to find specific information within the annual report.-
 1
1 -
2
-
3
-
4
-
5
-
6
-
7
-
8
-
9
-
10
-
11
-
12
-
13
-
14
-
15
-
16
-
17
-
18
-
19
-
20
-
21
-
22
-
23
-
24
-
25
-
26
-
27
-
28
-
29
-
30
-
31
-
32
-
33
-
34
-
35
-
36
-
37
-
38
-
39
-
40
-
41
-
42
-
43
-
44
-
45
-
46
-
47
-
48
-
49
-
50
-
51
-
52
-
53
-
54
-
55
-
56
-
57
-
58
-
59
-
60
-
61
-
62
-
63
-
64
-
65
-
66
-
67
-
68
-
69
-
70
-
71
-
72
-
73
-
74
-
75
-
76
-
77
-
78
-
79
-
80
-
81
-
82
-
83
-
84
-
85
-
86
-
87
-
88
-
89
-
90
-
91
-
92
-
93
-
94
-
95
-
96
-
97
-
98
-
99
-
100
-
101
-
102
-
103
-
104
-
105
-
106
-
107
-
108
-
109
-
110
-
111
-
112
-
113
-
114
-
115
-
116
-
117
-
118
-
119
-
120
-
121
-
122
-
 123
123 -
 124
124 -
 125
125 -
 126
126 -
 127
127 -
 128
128 -
 129
129 -
 130
130 -
 131
131 -
 132
132 -
 133
133 -
 134
134 -
 135
135 -
 136
136 -
 137
137 -
 138
138 -
 139
139 -
 140
140 -
 141
141 -
 142
142 -
 143
143 -
144
-
145
-
146
-
147
-
148
-
149
-
150
-
151
-
152
-
153
-
154
-
155
-
156
-
157
-
158
-
159
-
160
-
161
-
162
-
163
-
164
-
165
-
166
-
167
-
168
-
169
-
170
-
171
-
172
-
173
-
174
-
175
-
176
-
177
-
178
-
179
-
180
-
181
-
182
-
183
-
184
-
185
-
186
-
187
-
188
-
189
-
190
-
191
-
192
-
193
-
194
-
195
-
196
-
197
-
198
-
199
-
200
-
201
-
202
-
203
-
204
-
205
-
206
-
207
-
208
-
209
-
210
-
211
-
212
-
213
-
214
-
215
-
216
-
217
-
218
-
219
-
220
-
221
-
222
-
223
-
224
-
225
-
226
-
227
-
228
-
229
-
230
-
231
-
232
-
233
-
234
-
235
-
236
-
237
-
238
-
239
-
240
-
241
-
242
-
243
-
244
-
245
-
246
-
247
-
248
-
249
-
250
-
251
-
252
-
253
-
254
-
255
-
256
-
257
-
258
-
259
-
260
-
261
-
262
-
263
-
264
-
265
-
266
-
267
-
268
-
269
-
270
-
271
-
272
-
273
-
274
-
275
-
276
-
277
-
278
-
279
-
280
-
281
-
282
-
283
-
284
-
285
-
286
-
287
-
288
-
289
-
290
-
291
-
292
-
293
-
294
-
295
-
296
-
297
-
298
-
299
-
300
-
301
-
302
-
303
-
304
-
305
-
306
-
307
-
308
-
309
-
310
-
311
-
312
-
313
-
314
-
315
-
316
-
317
-
318
-
319
-
320
-
321
-
322
-
323
-
324
-
325
-
326
-
327
-
328
-
329
-
330
-
331
-
332
-
333
-
334
-
335
-
336
-
337
-
338
-
339
-
340
-
341
-
342
-
343
-
344
-
345
-
346
-
347
-
348
-
349
-
350
-
351
-
352
-
353
-
354
-
355
-
356
-
357
-
358
-
359
-
360
-
361
-
362
-
363
-
364
-
365
-
366
-
367
-
368
-
369
-
370
-
371
-
372
-
373
-
374
-
375
-
376
-
377
-
378
-
379
-
380
-
381
-
382
-
383
-
384
-
385
-
386
-
387
-
388
-
389
-
390
 |
 |

Business review
Risk, capital and liquidity management
131RBS Group Annual Report and Accounts 2009
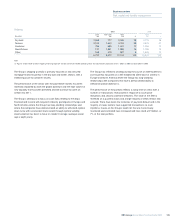
Key points
•There has been a sustained focus on country exposures, both in
terms of those countries that represent a larger concentration and
those that, under the country watch list process, have been identified
as exhibiting signs of actual or potential stress.
•This process, coupled with the Group’s strategic focus on a
reduced number of countries, has yielded material
reductions in exposure.
•The reductions are magnified by the relative strength of sterling in
the year, when it gained 9% on a trade weighted basis against other
currencies.
Most economies enter 2010 in a tentative recovery phase, attributed
largely to official stimulus, resilient consumption and global restocking.
International prospects vary and significant risks remain, particularly
around exiting government support, advanced sovereign debt levels
and rising inflationary pressures. Currently low yields may not last as
these trends play out. Asia remains the best performing region, thanks
to limited sovereign and corporate leverage. However, growth prospects
remain linked to global trade flows. Middle East sovereigns are generally
strong, but the private sector continues to feel the impact of weakness
in real estate and construction. Latin America proved relatively insulated
from the crisis, and policy gains look set to be sustained. Peripheral
Euro zone sovereigns with heavy debt burdens face increased risks,
with credible adjustment programmes needed. Eastern Europe has
made some progress in addressing key weaknesses, but vulnerabilities
in some countries remain and growth prospects are modest.
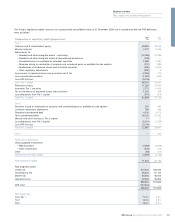
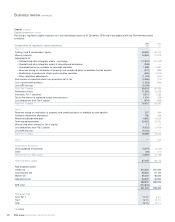
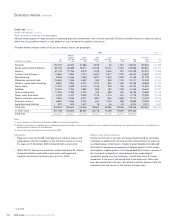
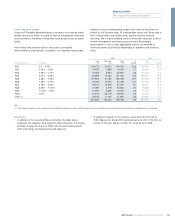
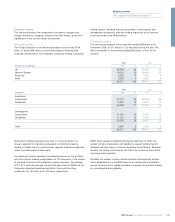
The country risk table below shows credit risk assets exceeding £1 billion by borrowers domiciled in countries with an external rating of A+ and below
from either Standard & Poor’s or Moody’s, and is stated gross of mitigating action which may have been taken to reduce or eliminate exposure to
country risk events.
2009 2008
Banks and Banks and
financial financial
Personal Sovereign institutions Corporate Total Core Non-Core Personal Sovereign institutions Corporate Total
£m £m £m £m £m £m £m £m £m £m £m £m
Italy 27 104 1,999 5,636 7,766 3,827 3,939 23 131 3,263 7,555 10,972
India 547 5 476 2,578 3,606 2,887 719 1,020 6 738 3,800 5,564
Russia 41 — 395 2,928 3,364 2,803 561 51 — 362 5,361 5,774
South Korea 1 — 1,038 2,308 3,347 3,238 109 2 — 1,743 1,104 2,849
Turkey 11 301 590 1,906 2,808 2,412 396 25 364 603 3,035 4,027
Poland 6 62 113 1,840 2,021 1,847 174 7 38 309 1,309 1,663
China 21 49 798 1,096 1,964 1,695 269 25 61 1,146 2,027 3,259
Romania 512 47 452 874 1,885 64 1,821 584 145 160 917 1,806
Portugal 5 42 281 1,119 1,447 943 504 6 34 405 1,914 2,359
Chile — 41 447 865 1,353 526 827 — 26 384 1,251 1,661
Brazil 3 — 767 439 1,209 1,151 58 4 — 1,012 642 1,658
Mexico 1 7 227 934 1,169 740 429 4 57 211 2,000 2,272
Kazakhstan 45 15 365 646 1,071 91 980 69 17 901 859 1,846
Hungary 3 23 56 956 1,038 579 459 5 74 101 831 1,011