RBS 2009 Annual Report Download - page 134
Download and view the complete annual report
Please find page 134 of the 2009 RBS annual report below. You can navigate through the pages in the report by either clicking on the pages listed below, or by using the keyword search tool below to find specific information within the annual report.-
 1
1 -
2
-
3
-
4
-
5
-
6
-
7
-
8
-
9
-
10
-
11
-
12
-
13
-
14
-
15
-
16
-
17
-
18
-
19
-
20
-
21
-
22
-
23
-
24
-
25
-
26
-
27
-
28
-
29
-
30
-
31
-
32
-
33
-
34
-
35
-
36
-
37
-
38
-
39
-
40
-
41
-
42
-
43
-
44
-
45
-
46
-
47
-
48
-
49
-
50
-
51
-
52
-
53
-
54
-
55
-
56
-
57
-
58
-
59
-
60
-
61
-
62
-
63
-
64
-
65
-
66
-
67
-
68
-
69
-
70
-
71
-
72
-
73
-
74
-
75
-
76
-
77
-
78
-
79
-
80
-
81
-
82
-
83
-
84
-
85
-
86
-
87
-
88
-
89
-
90
-
91
-
92
-
93
-
94
-
95
-
96
-
97
-
98
-
99
-
100
-
101
-
102
-
103
-
104
-
105
-
106
-
107
-
108
-
109
-
110
-
111
-
112
-
113
-
114
-
115
-
116
-
117
-
118
-
119
-
120
-
121
-
122
-
123
-
 124
124 -
 125
125 -
 126
126 -
 127
127 -
 128
128 -
 129
129 -
 130
130 -
 131
131 -
 132
132 -
 133
133 -
 134
134 -
 135
135 -
 136
136 -
 137
137 -
 138
138 -
 139
139 -
 140
140 -
 141
141 -
 142
142 -
 143
143 -
 144
144 -
145
-
146
-
147
-
148
-
149
-
150
-
151
-
152
-
153
-
154
-
155
-
156
-
157
-
158
-
159
-
160
-
161
-
162
-
163
-
164
-
165
-
166
-
167
-
168
-
169
-
170
-
171
-
172
-
173
-
174
-
175
-
176
-
177
-
178
-
179
-
180
-
181
-
182
-
183
-
184
-
185
-
186
-
187
-
188
-
189
-
190
-
191
-
192
-
193
-
194
-
195
-
196
-
197
-
198
-
199
-
200
-
201
-
202
-
203
-
204
-
205
-
206
-
207
-
208
-
209
-
210
-
211
-
212
-
213
-
214
-
215
-
216
-
217
-
218
-
219
-
220
-
221
-
222
-
223
-
224
-
225
-
226
-
227
-
228
-
229
-
230
-
231
-
232
-
233
-
234
-
235
-
236
-
237
-
238
-
239
-
240
-
241
-
242
-
243
-
244
-
245
-
246
-
247
-
248
-
249
-
250
-
251
-
252
-
253
-
254
-
255
-
256
-
257
-
258
-
259
-
260
-
261
-
262
-
263
-
264
-
265
-
266
-
267
-
268
-
269
-
270
-
271
-
272
-
273
-
274
-
275
-
276
-
277
-
278
-
279
-
280
-
281
-
282
-
283
-
284
-
285
-
286
-
287
-
288
-
289
-
290
-
291
-
292
-
293
-
294
-
295
-
296
-
297
-
298
-
299
-
300
-
301
-
302
-
303
-
304
-
305
-
306
-
307
-
308
-
309
-
310
-
311
-
312
-
313
-
314
-
315
-
316
-
317
-
318
-
319
-
320
-
321
-
322
-
323
-
324
-
325
-
326
-
327
-
328
-
329
-
330
-
331
-
332
-
333
-
334
-
335
-
336
-
337
-
338
-
339
-
340
-
341
-
342
-
343
-
344
-
345
-
346
-
347
-
348
-
349
-
350
-
351
-
352
-
353
-
354
-
355
-
356
-
357
-
358
-
359
-
360
-
361
-
362
-
363
-
364
-
365
-
366
-
367
-
368
-
369
-
370
-
371
-
372
-
373
-
374
-
375
-
376
-
377
-
378
-
379
-
380
-
381
-
382
-
383
-
384
-
385
-
386
-
387
-
388
-
389
-
390
 |
 |

Business review continued
RBS Group Annual Report and Accounts 2009132
Credit risk continued
Credit risk assets*continued
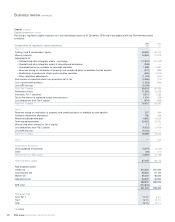
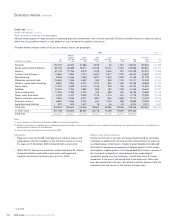
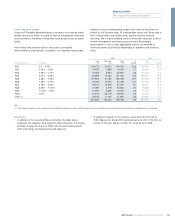
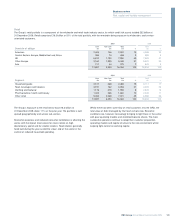
Asset quality by industry and geography
Industry analysis plays an important part in assessing potential concentration risk in the loan portfolio. Particular attention is given to industry sectors
where the Group believes there is a high degree of risk or potential for volatility in the future.
The table below analyses credit risk assets by industry sector and geography.
2009 2008
Western
Europe North Asia Latin of which
UK (excl. UK) America Pacific America Other (1) Total Core Total
Industry sector £m £m £m £m £m £m £m £m £m
Personal 120,720 23,530 37,680 2,948 63 1,361 186,302 165,562 197,888
Banks and financial institutions 38,775 66,698 18,817 13,158 10,216 5,305 152,969 133,900 180,504
Property 61,779 27,736 8,315 2,478 2,924 507 103,739 57,073 112,980
Transport and storage (2) 14,565 7,954 7,514 5,841 2,917 7,370 46,161 30,863 58,995
Manufacturing 9,309 14,646 7,965 3,627 1,643 3,948 41,138 31,199 67,846
Wholesale and retail trade 15,584 7,458 5,497 945 829 1,704 32,017 25,180 35,180
Telecom, media and technology 8,956 7,956 5,312 2,232 804 1,528 26,788 18,554 42,374
Public sector 11,091 4,448 6,016 2,109 279 760 24,703 21,823 39,890
Building 10,303 7,494 1,852 836 183 1,098 21,766 16,642 29,297
Tourism and leisure 11,396 3,268 2,700 755 586 481 19,186 15,583 19,528
Power, water and waste 4,745 6,197 3,502 1,179 1,215 941 17,779 12,055 26,628
Natural resources and nuclear 2,554 3,546 5,511 1,861 844 2,895 17,211 12,479 25,318
Business services 8,981 2,056 2,324 675 1,029 588 15,653 13,395 14,497
Agriculture and fisheries 921 618 1,671 18 64 82 3,374 3,214 3,951
2009 Total 319,679 183,605 114,676 38,662 23,596 28,568 708,786 557,522 854,876
of which Core 271,758 133,824 89,487 28,718 14,048 19,687 557,522
2008 Total 326,639 225,870 178,139 56,074 31,235 36,919 854,876
Notes:
(1) ‘Other’ comprises Central and Eastern Europe, Middle East, Central Asia and Africa.
(2) Excludes net investment in operating leases in Shipping and Aviation portfolios as they are accounted for as part of property, plant and equipment; however operating leases are included in the
monitoring and management of these portfolios.
(3) Certain sector and sub-sector classes were refined in 2009.
Key points
•Exposures have decreased materially across industry sectors and
geographies, with the exception of the UK where exposure is only
2% lower at 31 December 2009 compared with a year earlier.
•Within the UK, exposure to corporate sectors was down 8%. Banks,
financial institutions and public sector were unchanged and
exposure to personal customers was up 6% in 2009.
Single name concentrations
During the first half of the year, the Group implemented an enhanced
framework to address the risk arising from concentrations of exposure
to related groups of borrowers. Despite market illiquidity that reduced
the scope for exposure management strategies against certain assets,
and negative credit migration, that created additional cases in excess of
the framework’s parameters, some progress was made against
exceptions arising from the framework. Overall there were 9% fewer
exceptions at the end of the period than at the beginning. Plans have
been developed and continue to be refined to deliver alignment with the
framework over the course of the Group’s strategic plan.
* unaudited