RBS 2009 Annual Report Download - page 307
Download and view the complete annual report
Please find page 307 of the 2009 RBS annual report below. You can navigate through the pages in the report by either clicking on the pages listed below, or by using the keyword search tool below to find specific information within the annual report.-
 1
1 -
2
-
3
-
4
-
5
-
6
-
7
-
8
-
9
-
10
-
11
-
12
-
13
-
14
-
15
-
16
-
17
-
18
-
19
-
20
-
21
-
22
-
23
-
24
-
25
-
26
-
27
-
28
-
29
-
30
-
31
-
32
-
33
-
34
-
35
-
36
-
37
-
38
-
39
-
40
-
41
-
42
-
43
-
44
-
45
-
46
-
47
-
48
-
49
-
50
-
51
-
52
-
53
-
54
-
55
-
56
-
57
-
58
-
59
-
60
-
61
-
62
-
63
-
64
-
65
-
66
-
67
-
68
-
69
-
70
-
71
-
72
-
73
-
74
-
75
-
76
-
77
-
78
-
79
-
80
-
81
-
82
-
83
-
84
-
85
-
86
-
87
-
88
-
89
-
90
-
91
-
92
-
93
-
94
-
95
-
96
-
97
-
98
-
99
-
100
-
101
-
102
-
103
-
104
-
105
-
106
-
107
-
108
-
109
-
110
-
111
-
112
-
113
-
114
-
115
-
116
-
117
-
118
-
119
-
120
-
121
-
122
-
123
-
124
-
125
-
126
-
127
-
128
-
129
-
130
-
131
-
132
-
133
-
134
-
135
-
136
-
137
-
138
-
139
-
140
-
141
-
142
-
143
-
144
-
145
-
146
-
147
-
148
-
149
-
150
-
151
-
152
-
153
-
154
-
155
-
156
-
157
-
158
-
159
-
160
-
161
-
162
-
163
-
164
-
165
-
166
-
167
-
168
-
169
-
170
-
171
-
172
-
173
-
174
-
175
-
176
-
177
-
178
-
179
-
180
-
181
-
182
-
183
-
184
-
185
-
186
-
187
-
188
-
189
-
190
-
191
-
192
-
193
-
194
-
195
-
196
-
197
-
198
-
199
-
200
-
201
-
202
-
203
-
204
-
205
-
206
-
207
-
208
-
209
-
210
-
211
-
212
-
213
-
214
-
215
-
216
-
217
-
218
-
219
-
220
-
221
-
222
-
223
-
224
-
225
-
226
-
227
-
228
-
229
-
230
-
231
-
232
-
233
-
234
-
235
-
236
-
237
-
238
-
239
-
240
-
241
-
242
-
243
-
244
-
245
-
246
-
247
-
248
-
249
-
250
-
251
-
252
-
253
-
254
-
255
-
256
-
257
-
258
-
259
-
260
-
261
-
262
-
263
-
264
-
265
-
266
-
267
-
268
-
269
-
270
-
271
-
272
-
273
-
274
-
275
-
276
-
277
-
278
-
279
-
280
-
281
-
282
-
283
-
284
-
285
-
286
-
287
-
288
-
289
-
290
-
291
-
292
-
293
-
294
-
295
-
296
-
 297
297 -
 298
298 -
 299
299 -
 300
300 -
 301
301 -
 302
302 -
 303
303 -
 304
304 -
 305
305 -
 306
306 -
 307
307 -
 308
308 -
 309
309 -
 310
310 -
 311
311 -
 312
312 -
 313
313 -
 314
314 -
 315
315 -
 316
316 -
 317
317 -
318
-
319
-
320
-
321
-
322
-
323
-
324
-
325
-
326
-
327
-
328
-
329
-
330
-
331
-
332
-
333
-
334
-
335
-
336
-
337
-
338
-
339
-
340
-
341
-
342
-
343
-
344
-
345
-
346
-
347
-
348
-
349
-
350
-
351
-
352
-
353
-
354
-
355
-
356
-
357
-
358
-
359
-
360
-
361
-
362
-
363
-
364
-
365
-
366
-
367
-
368
-
369
-
370
-
371
-
372
-
373
-
374
-
375
-
376
-
377
-
378
-
379
-
380
-
381
-
382
-
383
-
384
-
385
-
386
-
387
-
388
-
389
-
390
 |
 |

305RBS Group Annual Report and Accounts 2009
Financial statements
Notes on the accounts
2009 2008 2007
£m £m £m
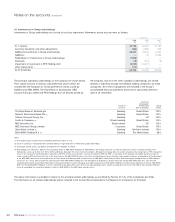
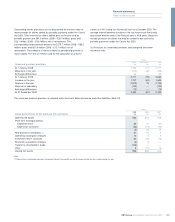
Property, plant and equipment pledged as security — — 935
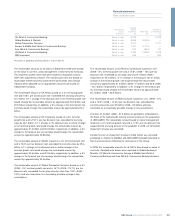
Investment properties are valued to reflect fair value, that is, the market
value of the Group’s interest at the reporting date excluding any special
terms or circumstances relating to the use or financing of the property
and transaction costs that would be incurred in making a sale.
Observed market data such as rental yield, replacement cost and useful
life, reflect relatively few transactions involving property that is not
necessarily identical to property owned by the Group.
Valuations are carried out by qualified surveyors who are members of
the Royal Institution of Chartered Surveyors, or an equivalent overseas
body. The valuation as at 31 December 2009 for a significant majority of
the Group’s investment properties was undertaken with the support of
external valuers.
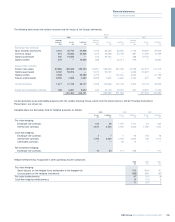
Investment property acquired during 2009 includes £1,336 million
arising on assumption by the Group of control of properties for which it
provided finance to a customer.
The fair value of investment properties includes £84 million (2008 – £172
million; 2007 – £234 million) of appreciation since purchase.
Rental income from investment properties was £233 million (2008 –
£257 million; 2007 – £300 million). Direct operating expenses of
investment properties were £16 million (2008 – £22 million; 2007 – £49
million).
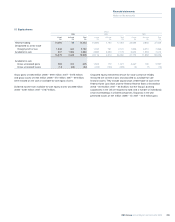
Property, plant and equipment, excluding investment properties, include
£213 million (2008 – £1,132 million; 2007 – £717 million) assets in the
course of construction.
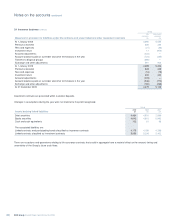
Freehold and long leasehold properties with a net book value of
£5 million (2008 – nil; 2007 – £451 million) were sold subject to
operating leases.
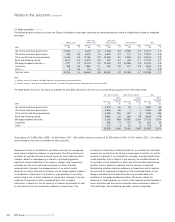
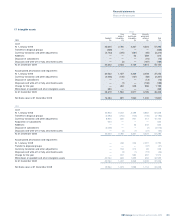
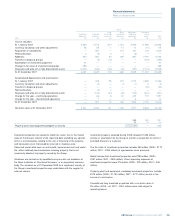
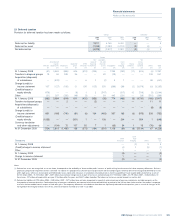
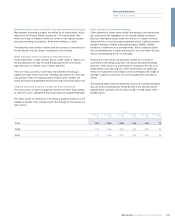
Group
Long Short Computers Operating
Investment Freehold leasehold leasehold and other lease
properties premises premises premises equipment assets Total
2007 £m £m £m £m £m £m £m
Cost or valuation:
At 1 January 2007 4,885 2,579 310 1,254 3,069 11,589 23,686
Currency translation and other adjustments 96 65 1 11 12 (10) 175
Acquisition of subsidiaries — 950 — 157 191 202 1,500
Reclassifications 3 (4) 3 1 (3) — —
Additions 450 592 34 309 857 2,791 5,033
Transfers to disposal groups — (4) (13) — — (422) (439)
Expenditure on investment properties 41—————41
Change in fair value of investment properties 288—————288
Disposals and write-off of fully depreciated assets (2,332) (533) (120) (44) (197) (2,713) (5,939)
At 31 December 2007 3,431 3,645 215 1,688 3,929 11,437 24,345
Accumulated depreciation and amortisation:
At 1 January 2007 — 446 96 374 1,670 2,680 5,266
Currency translation and other adjustments — (4) — (1) (1) 2 (4)
Transfers to disposal groups —————(52) (52)
Reclassifications — (2)2————
Disposals and write-off of fully depreciated assets — (122) (32) (25) (132) (610) (921)
Charge for the year – continuing operations — 66 8 87 409 727 1,297
Charge for the year – discontinued operations —7—16—14
At 31 December 2007 — 391 74 436 1,952 2,747 5,600
Net book value at 31 December 2007 3,431 3,254 141 1,252 1,977 8,690 18,745