RBS 2009 Annual Report Download - page 136
Download and view the complete annual report
Please find page 136 of the 2009 RBS annual report below. You can navigate through the pages in the report by either clicking on the pages listed below, or by using the keyword search tool below to find specific information within the annual report.-
 1
1 -
2
-
3
-
4
-
5
-
6
-
7
-
8
-
9
-
10
-
11
-
12
-
13
-
14
-
15
-
16
-
17
-
18
-
19
-
20
-
21
-
22
-
23
-
24
-
25
-
26
-
27
-
28
-
29
-
30
-
31
-
32
-
33
-
34
-
35
-
36
-
37
-
38
-
39
-
40
-
41
-
42
-
43
-
44
-
45
-
46
-
47
-
48
-
49
-
50
-
51
-
52
-
53
-
54
-
55
-
56
-
57
-
58
-
59
-
60
-
61
-
62
-
63
-
64
-
65
-
66
-
67
-
68
-
69
-
70
-
71
-
72
-
73
-
74
-
75
-
76
-
77
-
78
-
79
-
80
-
81
-
82
-
83
-
84
-
85
-
86
-
87
-
88
-
89
-
90
-
91
-
92
-
93
-
94
-
95
-
96
-
97
-
98
-
99
-
100
-
101
-
102
-
103
-
104
-
105
-
106
-
107
-
108
-
109
-
110
-
111
-
112
-
113
-
114
-
115
-
116
-
117
-
118
-
119
-
120
-
121
-
122
-
123
-
124
-
125
-
 126
126 -
 127
127 -
 128
128 -
 129
129 -
 130
130 -
 131
131 -
 132
132 -
 133
133 -
 134
134 -
 135
135 -
 136
136 -
 137
137 -
 138
138 -
 139
139 -
 140
140 -
 141
141 -
 142
142 -
 143
143 -
 144
144 -
 145
145 -
 146
146 -
147
-
148
-
149
-
150
-
151
-
152
-
153
-
154
-
155
-
156
-
157
-
158
-
159
-
160
-
161
-
162
-
163
-
164
-
165
-
166
-
167
-
168
-
169
-
170
-
171
-
172
-
173
-
174
-
175
-
176
-
177
-
178
-
179
-
180
-
181
-
182
-
183
-
184
-
185
-
186
-
187
-
188
-
189
-
190
-
191
-
192
-
193
-
194
-
195
-
196
-
197
-
198
-
199
-
200
-
201
-
202
-
203
-
204
-
205
-
206
-
207
-
208
-
209
-
210
-
211
-
212
-
213
-
214
-
215
-
216
-
217
-
218
-
219
-
220
-
221
-
222
-
223
-
224
-
225
-
226
-
227
-
228
-
229
-
230
-
231
-
232
-
233
-
234
-
235
-
236
-
237
-
238
-
239
-
240
-
241
-
242
-
243
-
244
-
245
-
246
-
247
-
248
-
249
-
250
-
251
-
252
-
253
-
254
-
255
-
256
-
257
-
258
-
259
-
260
-
261
-
262
-
263
-
264
-
265
-
266
-
267
-
268
-
269
-
270
-
271
-
272
-
273
-
274
-
275
-
276
-
277
-
278
-
279
-
280
-
281
-
282
-
283
-
284
-
285
-
286
-
287
-
288
-
289
-
290
-
291
-
292
-
293
-
294
-
295
-
296
-
297
-
298
-
299
-
300
-
301
-
302
-
303
-
304
-
305
-
306
-
307
-
308
-
309
-
310
-
311
-
312
-
313
-
314
-
315
-
316
-
317
-
318
-
319
-
320
-
321
-
322
-
323
-
324
-
325
-
326
-
327
-
328
-
329
-
330
-
331
-
332
-
333
-
334
-
335
-
336
-
337
-
338
-
339
-
340
-
341
-
342
-
343
-
344
-
345
-
346
-
347
-
348
-
349
-
350
-
351
-
352
-
353
-
354
-
355
-
356
-
357
-
358
-
359
-
360
-
361
-
362
-
363
-
364
-
365
-
366
-
367
-
368
-
369
-
370
-
371
-
372
-
373
-
374
-
375
-
376
-
377
-
378
-
379
-
380
-
381
-
382
-
383
-
384
-
385
-
386
-
387
-
388
-
389
-
390
 |
 |

Business review continued
RBS Group Annual Report and Accounts 2009134
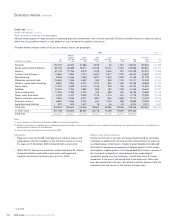
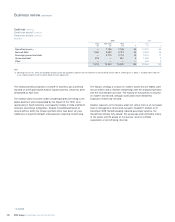
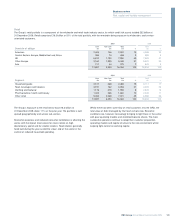
Credit risk continued
Credit risk assets*continued
Key credit portfolios
2009 2008
Personal credit risk assets £m £m
UK Retail:
– Mortgages 85,529 74,528
– Cards, loans and overdrafts 20,316 22,475
Ulster Bank:
– Mortgages 22,304 24,531
– Other personal 1,172 1,350
Citizens:
– Mortgages 26,534 34,394
– Auto and cards 6,917 9,126
– Other (1) 4,205 5,286
EMEA and Asia Pacific Non-Core 3,084 3,942
Other (2) 16,241 22,256
186,302 197,888
Notes:
(1) Mainly student loans and recreational vehicles/marine.
(2) Personal exposures in other divisions, including Wealth, and RBS Insurance.
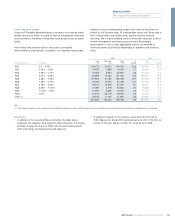
Residential mortgages
The table below analyses the distribution of residential mortgages by loan-to-value (LTV) (indexed).
UK Retail Ulster Bank Citizens
Residential mortgages – 2009 2008 2009 2008 2009 2008
distribution by average LTV (1) (indexed) %%%%%%
<= 50% 39.2 46.0 40.7 47.1 26.3 29.7
> 50% and <= 60% 10.1 10.9 7.6 8.7 7.9 9.0
> 60% and <= 70% 10.9 10.6 7.6 8.4 9.0 10.7
> 70% and <= 80% 13.3 10.5 7.5 8.6 12.7 16.3
> 80% and <= 90% 11.2 9.2 8.0 9.6 14.5 15.5
> 90% and <= 100% 7.6 7.8 9.0 8.5 12.2 9.5
> 100% 7.7 4.9 19.6 9.1 17.4 9.3
Total portfolio average LTV at 31 December 59.1 54.5 62.5 54.3 72.0 69.1
Average LTV on new originations during the year 67.2 67.2 72.8 71.1 62.4 64.3
Note:
(1) LTV averages calculated by transaction volume.
* unaudited