RBS 2009 Annual Report Download - page 192
Download and view the complete annual report
Please find page 192 of the 2009 RBS annual report below. You can navigate through the pages in the report by either clicking on the pages listed below, or by using the keyword search tool below to find specific information within the annual report.-
 1
1 -
2
-
3
-
4
-
5
-
6
-
7
-
8
-
9
-
10
-
11
-
12
-
13
-
14
-
15
-
16
-
17
-
18
-
19
-
20
-
21
-
22
-
23
-
24
-
25
-
26
-
27
-
28
-
29
-
30
-
31
-
32
-
33
-
34
-
35
-
36
-
37
-
38
-
39
-
40
-
41
-
42
-
43
-
44
-
45
-
46
-
47
-
48
-
49
-
50
-
51
-
52
-
53
-
54
-
55
-
56
-
57
-
58
-
59
-
60
-
61
-
62
-
63
-
64
-
65
-
66
-
67
-
68
-
69
-
70
-
71
-
72
-
73
-
74
-
75
-
76
-
77
-
78
-
79
-
80
-
81
-
82
-
83
-
84
-
85
-
86
-
87
-
88
-
89
-
90
-
91
-
92
-
93
-
94
-
95
-
96
-
97
-
98
-
99
-
100
-
101
-
102
-
103
-
104
-
105
-
106
-
107
-
108
-
109
-
110
-
111
-
112
-
113
-
114
-
115
-
116
-
117
-
118
-
119
-
120
-
121
-
122
-
123
-
124
-
125
-
126
-
127
-
128
-
129
-
130
-
131
-
132
-
133
-
134
-
135
-
136
-
137
-
138
-
139
-
140
-
141
-
142
-
143
-
144
-
145
-
146
-
147
-
148
-
149
-
150
-
151
-
152
-
153
-
154
-
155
-
156
-
157
-
158
-
159
-
160
-
161
-
162
-
163
-
164
-
165
-
166
-
167
-
168
-
169
-
170
-
171
-
172
-
173
-
174
-
175
-
176
-
177
-
178
-
179
-
180
-
181
-
 182
182 -
 183
183 -
 184
184 -
 185
185 -
 186
186 -
 187
187 -
 188
188 -
 189
189 -
 190
190 -
 191
191 -
 192
192 -
 193
193 -
 194
194 -
 195
195 -
 196
196 -
 197
197 -
 198
198 -
 199
199 -
 200
200 -
 201
201 -
 202
202 -
203
-
204
-
205
-
206
-
207
-
208
-
209
-
210
-
211
-
212
-
213
-
214
-
215
-
216
-
217
-
218
-
219
-
220
-
221
-
222
-
223
-
224
-
225
-
226
-
227
-
228
-
229
-
230
-
231
-
232
-
233
-
234
-
235
-
236
-
237
-
238
-
239
-
240
-
241
-
242
-
243
-
244
-
245
-
246
-
247
-
248
-
249
-
250
-
251
-
252
-
253
-
254
-
255
-
256
-
257
-
258
-
259
-
260
-
261
-
262
-
263
-
264
-
265
-
266
-
267
-
268
-
269
-
270
-
271
-
272
-
273
-
274
-
275
-
276
-
277
-
278
-
279
-
280
-
281
-
282
-
283
-
284
-
285
-
286
-
287
-
288
-
289
-
290
-
291
-
292
-
293
-
294
-
295
-
296
-
297
-
298
-
299
-
300
-
301
-
302
-
303
-
304
-
305
-
306
-
307
-
308
-
309
-
310
-
311
-
312
-
313
-
314
-
315
-
316
-
317
-
318
-
319
-
320
-
321
-
322
-
323
-
324
-
325
-
326
-
327
-
328
-
329
-
330
-
331
-
332
-
333
-
334
-
335
-
336
-
337
-
338
-
339
-
340
-
341
-
342
-
343
-
344
-
345
-
346
-
347
-
348
-
349
-
350
-
351
-
352
-
353
-
354
-
355
-
356
-
357
-
358
-
359
-
360
-
361
-
362
-
363
-
364
-
365
-
366
-
367
-
368
-
369
-
370
-
371
-
372
-
373
-
374
-
375
-
376
-
377
-
378
-
379
-
380
-
381
-
382
-
383
-
384
-
385
-
386
-
387
-
388
-
389
-
390
 |
 |

Business review continued
RBS Group Annual Report and Accounts 2009190
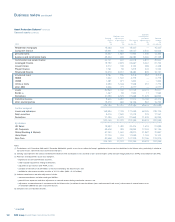
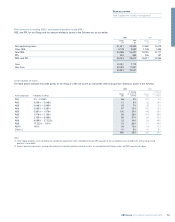
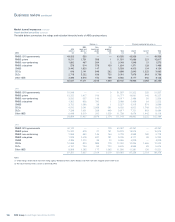
Market turmoil exposures continued
Asset-backed securities continued
Residential mortgage-backed securities (RMBS) continued
RMBS: G10 government securities comprise securities that are:
•Guaranteed or effectively guaranteed by the US government, by way
of its support for US federal agencies and GSEs;
•Guaranteed by the Dutch government; and
•Covered bonds, referencing primarily Dutch and Spanish
government-backed loans.
Guaranteed or effectively guaranteed mortgages are mortgages that form
part of a mortgage-backed security issuance by a government agency,
or in the US an entity that benefits from a guarantee (direct or indirect)
provided by the US government. For US RMBS, this category includes
RMBS issued by Ginnie Mae, Freddie Mac and Fannie Mae. European
RMBS includes mortgages guaranteed by the Dutch Government.
Covered mortgage bonds are debt instruments that have recourse to a
pool of mortgage assets, where investors have a preferred claim if a
default occurs. These underlying assets are segregated from the other
assets held by the issuing entity.
Prime mortgages are those of a higher credit quality than non-
conforming and sub-prime mortgages, and exclude guaranteed and
covered bond mortgages.
Non-conforming mortgages (or ‘Alt-A’ used for US exposure) have a
higher credit quality than sub-prime mortgages, but lower than prime
borrowers. Within the US mortgage industry, non-conforming mortgages
are those that do not meet the lending criteria for US agency mortgages
(described below). For non-US mortgages, judgement is applied in
identifying loans with similar characteristics to US non-conforming loans
and also includes self-certified loans. Alt-A describes a category of
mortgages in which lenders consider the risk to be greater than prime
mortgages though less than sub-prime. The offered interest rate is
usually representative of the associated risk level.
Sub-prime mortgages are loans to sub-prime borrowers typically having
weakened credit histories that include payment delinquencies and
potentially more severe problems such as court judgements and
bankruptcies. They may also display reduced repayment capacity as
measured by credit scores, high debt-to-income ratios, or other criteria
indicating heightened risk of default.
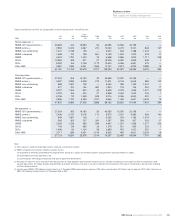
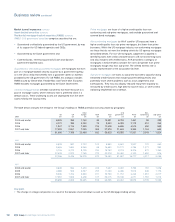
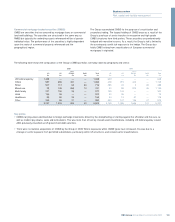
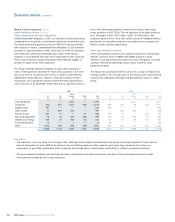
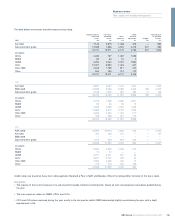
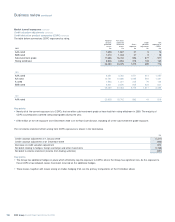
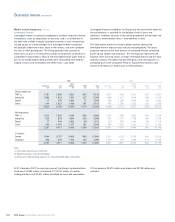
The table below analyses the vintage of the Group’s holdings of RMBS portfolios (carrying value) by geography.
Other G10 Non-
US UK Europe RoW Total goverments Prime conforming Sub-prime
2009 £m £m £m £m £m £m £m £m £m
2004 and earlier 8,505 293 1,760 33 10,591 8,703 1,461 99 328
2005 4,221 783 4,252 74 9,330 6,383 2,173 510 264
2006 1,847 3,116 7,449 216 12,628 6,826 4,514 690 598
2007 and later 17,093 2,967 7,005 309 27,374 21,643 3,353 1,744 634
31,666 7,159 20,466 632 59,923 43,555 11,501 3,043 1,824
2008
2004 and earlier 6,839 887 2,122 102 9,950 6,661 2,507 122 660
2005 9,666 1,694 5,265 65 16,690 10,172 4,794 1,371 353
2006 3,136 3,273 9,139 234 15,782 8,274 5,376 872 1,260
2007 and later 22,425 2,572 7,749 272 33,018 26,450 4,100 1,652 816
42,066 8,426 24,275 673 75,440 51,557 16,777 4,017 3,089
2007
2004 and earlier 3,848 946 2,420 243 7,457 3,492 2,750 187 1,028
2005 4,988 523 5,257 252 11,020 6,486 2,910 448 1,176
2006 9,496 1,416 9,540 311 20,763 11,151 6,244 1,351 2,017
2007 and later 17,557 1,923 6,428 107 26,015 19,138 4,071 1,792 1,014
35,889 4,808 23,645 913 65,255 40,267 15,975 3,778 5,235
Key point
• The change in vintage composition is a result of the balance sheet sell-down as well as the US Mortgage trading activity.