RBS 2009 Annual Report Download - page 148
Download and view the complete annual report
Please find page 148 of the 2009 RBS annual report below. You can navigate through the pages in the report by either clicking on the pages listed below, or by using the keyword search tool below to find specific information within the annual report.-
 1
1 -
2
-
3
-
4
-
5
-
6
-
7
-
8
-
9
-
10
-
11
-
12
-
13
-
14
-
15
-
16
-
17
-
18
-
19
-
20
-
21
-
22
-
23
-
24
-
25
-
26
-
27
-
28
-
29
-
30
-
31
-
32
-
33
-
34
-
35
-
36
-
37
-
38
-
39
-
40
-
41
-
42
-
43
-
44
-
45
-
46
-
47
-
48
-
49
-
50
-
51
-
52
-
53
-
54
-
55
-
56
-
57
-
58
-
59
-
60
-
61
-
62
-
63
-
64
-
65
-
66
-
67
-
68
-
69
-
70
-
71
-
72
-
73
-
74
-
75
-
76
-
77
-
78
-
79
-
80
-
81
-
82
-
83
-
84
-
85
-
86
-
87
-
88
-
89
-
90
-
91
-
92
-
93
-
94
-
95
-
96
-
97
-
98
-
99
-
100
-
101
-
102
-
103
-
104
-
105
-
106
-
107
-
108
-
109
-
110
-
111
-
112
-
113
-
114
-
115
-
116
-
117
-
118
-
119
-
120
-
121
-
122
-
123
-
124
-
125
-
126
-
127
-
128
-
129
-
130
-
131
-
132
-
133
-
134
-
135
-
136
-
137
-
 138
138 -
 139
139 -
 140
140 -
 141
141 -
 142
142 -
 143
143 -
 144
144 -
 145
145 -
 146
146 -
 147
147 -
 148
148 -
 149
149 -
 150
150 -
 151
151 -
 152
152 -
 153
153 -
 154
154 -
 155
155 -
 156
156 -
 157
157 -
 158
158 -
159
-
160
-
161
-
162
-
163
-
164
-
165
-
166
-
167
-
168
-
169
-
170
-
171
-
172
-
173
-
174
-
175
-
176
-
177
-
178
-
179
-
180
-
181
-
182
-
183
-
184
-
185
-
186
-
187
-
188
-
189
-
190
-
191
-
192
-
193
-
194
-
195
-
196
-
197
-
198
-
199
-
200
-
201
-
202
-
203
-
204
-
205
-
206
-
207
-
208
-
209
-
210
-
211
-
212
-
213
-
214
-
215
-
216
-
217
-
218
-
219
-
220
-
221
-
222
-
223
-
224
-
225
-
226
-
227
-
228
-
229
-
230
-
231
-
232
-
233
-
234
-
235
-
236
-
237
-
238
-
239
-
240
-
241
-
242
-
243
-
244
-
245
-
246
-
247
-
248
-
249
-
250
-
251
-
252
-
253
-
254
-
255
-
256
-
257
-
258
-
259
-
260
-
261
-
262
-
263
-
264
-
265
-
266
-
267
-
268
-
269
-
270
-
271
-
272
-
273
-
274
-
275
-
276
-
277
-
278
-
279
-
280
-
281
-
282
-
283
-
284
-
285
-
286
-
287
-
288
-
289
-
290
-
291
-
292
-
293
-
294
-
295
-
296
-
297
-
298
-
299
-
300
-
301
-
302
-
303
-
304
-
305
-
306
-
307
-
308
-
309
-
310
-
311
-
312
-
313
-
314
-
315
-
316
-
317
-
318
-
319
-
320
-
321
-
322
-
323
-
324
-
325
-
326
-
327
-
328
-
329
-
330
-
331
-
332
-
333
-
334
-
335
-
336
-
337
-
338
-
339
-
340
-
341
-
342
-
343
-
344
-
345
-
346
-
347
-
348
-
349
-
350
-
351
-
352
-
353
-
354
-
355
-
356
-
357
-
358
-
359
-
360
-
361
-
362
-
363
-
364
-
365
-
366
-
367
-
368
-
369
-
370
-
371
-
372
-
373
-
374
-
375
-
376
-
377
-
378
-
379
-
380
-
381
-
382
-
383
-
384
-
385
-
386
-
387
-
388
-
389
-
390
 |
 |

Business review continued
RBS Group Annual Report and Accounts 2009146
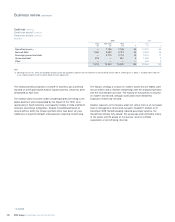
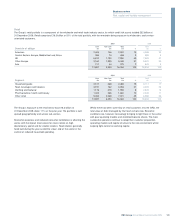
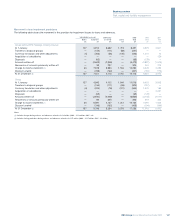
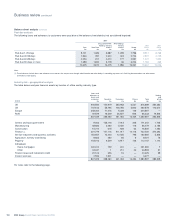
Credit risk continued
Analysis of loan impairment charge
2009 2008 2007
Group Group Group
before RFS RFS before RFS before RFS
Holdings Holdings Holdings Holdings
minority minority minority minority
Core Non-Core interest interest Group interest Group interest Group
£m £m £m £m £m £m £m £m £m
Latent loss 991 193 1,184 128 1,312 769 822 25 88
Collectively assessed 2,545 1,449 3,994 203 4,197 2,391 2,606 1,813 1,584
Individually assessed (1) 1,019 6,859 7,878 713 8,591 3,200 3,545 244 274
Charge to income statement (2) 4,555 8,501 13,056 1,044 14,100 6,360 6,973 2,082 1,946
Charge as a % of customer loans
and advances – gross (3) 1.1% 5.7% 2.3% 0.8% 2.0% 0.9% 0.8% 0.4% 0.3%
Notes:
(1) Excludes loan impairment charge against loans and advances to banks of £34 million (2008 – £118 million; 2007 – nil).
(2) Excludes impairments of available-for-sale securities of £816 million (2008 – £981 million; 2007 – £22 million).
(3) Gross of provisions and excluding reverse repurchase agreements. Includes gross loans relating to disposal groups.
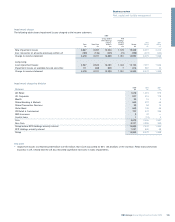
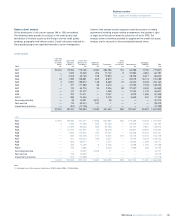
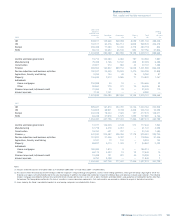
Analysis of loan impairment provisions on loans to customers
2009 2008 2007
Group Group Group
before RFS RFS before RFS before RFS
Holdings Holdings Holdings Holdings
minority minority minority minority
Core Non-Core interest interest Group interest Group interest Group
£m £m £m £m £m £m £m £m £m
Latent loss 2,005 735 2,740 336 3,076 1,719 1,944 734 1,050
Collectively assessed 3,509 1,266 4,775 479 5,254 3,692 4,102 3,162 3,845
Individually assessed (1) 1,272 6,229 7,501 1,295 8,796 3,913 4,843 1,073 1,554
6,786 8,230 15,016 2,110 17,126 9,324 10,889 4,969 6,449
Note:
(1) Excludes provision of £157 million relating to loans and advances to banks (2008 – £127 million; 2007 – £3 million).