RBS 2009 Annual Report Download - page 183
Download and view the complete annual report
Please find page 183 of the 2009 RBS annual report below. You can navigate through the pages in the report by either clicking on the pages listed below, or by using the keyword search tool below to find specific information within the annual report.-
 1
1 -
2
-
3
-
4
-
5
-
6
-
7
-
8
-
9
-
10
-
11
-
12
-
13
-
14
-
15
-
16
-
17
-
18
-
19
-
20
-
21
-
22
-
23
-
24
-
25
-
26
-
27
-
28
-
29
-
30
-
31
-
32
-
33
-
34
-
35
-
36
-
37
-
38
-
39
-
40
-
41
-
42
-
43
-
44
-
45
-
46
-
47
-
48
-
49
-
50
-
51
-
52
-
53
-
54
-
55
-
56
-
57
-
58
-
59
-
60
-
61
-
62
-
63
-
64
-
65
-
66
-
67
-
68
-
69
-
70
-
71
-
72
-
73
-
74
-
75
-
76
-
77
-
78
-
79
-
80
-
81
-
82
-
83
-
84
-
85
-
86
-
87
-
88
-
89
-
90
-
91
-
92
-
93
-
94
-
95
-
96
-
97
-
98
-
99
-
100
-
101
-
102
-
103
-
104
-
105
-
106
-
107
-
108
-
109
-
110
-
111
-
112
-
113
-
114
-
115
-
116
-
117
-
118
-
119
-
120
-
121
-
122
-
123
-
124
-
125
-
126
-
127
-
128
-
129
-
130
-
131
-
132
-
133
-
134
-
135
-
136
-
137
-
138
-
139
-
140
-
141
-
142
-
143
-
144
-
145
-
146
-
147
-
148
-
149
-
150
-
151
-
152
-
153
-
154
-
155
-
156
-
157
-
158
-
159
-
160
-
161
-
162
-
163
-
164
-
165
-
166
-
167
-
168
-
169
-
170
-
171
-
172
-
 173
173 -
 174
174 -
 175
175 -
 176
176 -
 177
177 -
 178
178 -
 179
179 -
 180
180 -
 181
181 -
 182
182 -
 183
183 -
 184
184 -
 185
185 -
 186
186 -
 187
187 -
 188
188 -
 189
189 -
 190
190 -
 191
191 -
 192
192 -
 193
193 -
194
-
195
-
196
-
197
-
198
-
199
-
200
-
201
-
202
-
203
-
204
-
205
-
206
-
207
-
208
-
209
-
210
-
211
-
212
-
213
-
214
-
215
-
216
-
217
-
218
-
219
-
220
-
221
-
222
-
223
-
224
-
225
-
226
-
227
-
228
-
229
-
230
-
231
-
232
-
233
-
234
-
235
-
236
-
237
-
238
-
239
-
240
-
241
-
242
-
243
-
244
-
245
-
246
-
247
-
248
-
249
-
250
-
251
-
252
-
253
-
254
-
255
-
256
-
257
-
258
-
259
-
260
-
261
-
262
-
263
-
264
-
265
-
266
-
267
-
268
-
269
-
270
-
271
-
272
-
273
-
274
-
275
-
276
-
277
-
278
-
279
-
280
-
281
-
282
-
283
-
284
-
285
-
286
-
287
-
288
-
289
-
290
-
291
-
292
-
293
-
294
-
295
-
296
-
297
-
298
-
299
-
300
-
301
-
302
-
303
-
304
-
305
-
306
-
307
-
308
-
309
-
310
-
311
-
312
-
313
-
314
-
315
-
316
-
317
-
318
-
319
-
320
-
321
-
322
-
323
-
324
-
325
-
326
-
327
-
328
-
329
-
330
-
331
-
332
-
333
-
334
-
335
-
336
-
337
-
338
-
339
-
340
-
341
-
342
-
343
-
344
-
345
-
346
-
347
-
348
-
349
-
350
-
351
-
352
-
353
-
354
-
355
-
356
-
357
-
358
-
359
-
360
-
361
-
362
-
363
-
364
-
365
-
366
-
367
-
368
-
369
-
370
-
371
-
372
-
373
-
374
-
375
-
376
-
377
-
378
-
379
-
380
-
381
-
382
-
383
-
384
-
385
-
386
-
387
-
388
-
389
-
390
 |
 |

Business review
Risk, capital and liquidity management
181RBS Group Annual Report and Accounts 2009
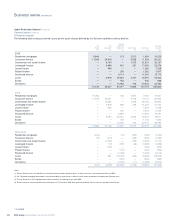
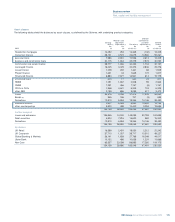
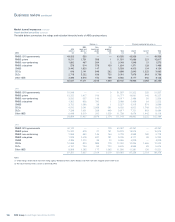
Sector analysis
The table below analyses covered assets by sector and division; and by sector and HMT asset class at 31 December 2009 and 31 December 2008.
2009
UK UK Ulster Covered Covered
Retail Corporate GBM Bank Non-Core amount amount 2008
£m £m £m £m £m £m £m
Financial institutions — 1,427 11,303 35 35,985 48,750 64,027
Manufacturing — 1,673 6,849 230 8,127 16,879 20,053
Natural resources — 629 2,530 45 2,117 5,321 8,122
Property — 9,990 8,349 1,550 27,931 47,820 60,217
Retail and leisure — 4,292 4,608 964 4,305 14,169 17,975
Services — 1,885 1,159 324 2,689 6,057 8,484
TMT — 608 3,985 263 5,852 10,708 14,535
Transport — 3,962 5,118 116 3,579 12,775 15,726
Personal and SME 21,242 24,761 116 8,342 13,590 68,051 72,820
21,242 49,227 44,017 11,869 104,175 230,530 281,959
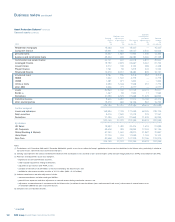
Residential Consumer Commercial Leveraged Lease Project Structured Covered
mortgages finance real estate finance finance finance finance Loan Bonds Derivative amount
2009 £m £m £m £m £m £m £m £m £m £m £m
Financial institutions — — 818 1,620 18 — 13,769 9,741 337 22,447 48,750
Manufacturing — — — 5,906 120 6 6 9,782 48 1,011 16,879
Natural resources — — — 1,260 41 1,065 9 2,458 46 442 5,321
Property — — 30,636 1,810 564 298 486 9,058 53 4,915 47,820
Retail and leisure — — 616 3,510 40 142 369 7,819 74 1,599 14,169
Services — — 29 3,213 320 104 191 1,572 6 622 6,057
TMT — — — 5,490 9 — 3 3,908 11 1,287 10,708
Transport — — 35 465 273 202 342 10,171 123 1,164 12,775
Personal and SME 14,205 53,261 3 2 144 — — 433 — 3 68,051
14,205 53,261 32,137 23,276 1,529 1,817 15,175 54,942 698 33,490 230,530
2008
Financial Institutions — — 638 4,196 28 138 17,288 15,478 514 25,747 64,027
Manufacturing — — — 4,895 196 14 7 13,233 60 1,648 20,053
Natural resources — — — 1,484 60 1,261 11 4,699 53 554 8,122
Property — — 38,467 2,188 876 388 550 12,289 128 5,331 60,217
Retail and leisure — — 679 4,067 63 151 443 10,417 165 1,990 17,975
Services — — 31 3,773 556 66 519 2,832 13 694 8,484
TMT — — — 6,591 13 — 3 5,918 406 1,604 14,535
Transport — — 35 537 369 225 370 12,619 149 1,422 15,726
Personal and SME 15,427 54,543 — 3 277 — — 2,492 75 3 72,820
15,427 54,543 39,850 27,734 2,438 2,243 19,191 79,977 1,563 38,993 281,959