RBS 2009 Annual Report Download - page 311
Download and view the complete annual report
Please find page 311 of the 2009 RBS annual report below. You can navigate through the pages in the report by either clicking on the pages listed below, or by using the keyword search tool below to find specific information within the annual report.-
 1
1 -
2
-
3
-
4
-
5
-
6
-
7
-
8
-
9
-
10
-
11
-
12
-
13
-
14
-
15
-
16
-
17
-
18
-
19
-
20
-
21
-
22
-
23
-
24
-
25
-
26
-
27
-
28
-
29
-
30
-
31
-
32
-
33
-
34
-
35
-
36
-
37
-
38
-
39
-
40
-
41
-
42
-
43
-
44
-
45
-
46
-
47
-
48
-
49
-
50
-
51
-
52
-
53
-
54
-
55
-
56
-
57
-
58
-
59
-
60
-
61
-
62
-
63
-
64
-
65
-
66
-
67
-
68
-
69
-
70
-
71
-
72
-
73
-
74
-
75
-
76
-
77
-
78
-
79
-
80
-
81
-
82
-
83
-
84
-
85
-
86
-
87
-
88
-
89
-
90
-
91
-
92
-
93
-
94
-
95
-
96
-
97
-
98
-
99
-
100
-
101
-
102
-
103
-
104
-
105
-
106
-
107
-
108
-
109
-
110
-
111
-
112
-
113
-
114
-
115
-
116
-
117
-
118
-
119
-
120
-
121
-
122
-
123
-
124
-
125
-
126
-
127
-
128
-
129
-
130
-
131
-
132
-
133
-
134
-
135
-
136
-
137
-
138
-
139
-
140
-
141
-
142
-
143
-
144
-
145
-
146
-
147
-
148
-
149
-
150
-
151
-
152
-
153
-
154
-
155
-
156
-
157
-
158
-
159
-
160
-
161
-
162
-
163
-
164
-
165
-
166
-
167
-
168
-
169
-
170
-
171
-
172
-
173
-
174
-
175
-
176
-
177
-
178
-
179
-
180
-
181
-
182
-
183
-
184
-
185
-
186
-
187
-
188
-
189
-
190
-
191
-
192
-
193
-
194
-
195
-
196
-
197
-
198
-
199
-
200
-
201
-
202
-
203
-
204
-
205
-
206
-
207
-
208
-
209
-
210
-
211
-
212
-
213
-
214
-
215
-
216
-
217
-
218
-
219
-
220
-
221
-
222
-
223
-
224
-
225
-
226
-
227
-
228
-
229
-
230
-
231
-
232
-
233
-
234
-
235
-
236
-
237
-
238
-
239
-
240
-
241
-
242
-
243
-
244
-
245
-
246
-
247
-
248
-
249
-
250
-
251
-
252
-
253
-
254
-
255
-
256
-
257
-
258
-
259
-
260
-
261
-
262
-
263
-
264
-
265
-
266
-
267
-
268
-
269
-
270
-
271
-
272
-
273
-
274
-
275
-
276
-
277
-
278
-
279
-
280
-
281
-
282
-
283
-
284
-
285
-
286
-
287
-
288
-
289
-
290
-
291
-
292
-
293
-
294
-
295
-
296
-
297
-
298
-
299
-
300
-
 301
301 -
 302
302 -
 303
303 -
 304
304 -
 305
305 -
 306
306 -
 307
307 -
 308
308 -
 309
309 -
 310
310 -
 311
311 -
 312
312 -
 313
313 -
 314
314 -
 315
315 -
 316
316 -
 317
317 -
 318
318 -
 319
319 -
 320
320 -
 321
321 -
322
-
323
-
324
-
325
-
326
-
327
-
328
-
329
-
330
-
331
-
332
-
333
-
334
-
335
-
336
-
337
-
338
-
339
-
340
-
341
-
342
-
343
-
344
-
345
-
346
-
347
-
348
-
349
-
350
-
351
-
352
-
353
-
354
-
355
-
356
-
357
-
358
-
359
-
360
-
361
-
362
-
363
-
364
-
365
-
366
-
367
-
368
-
369
-
370
-
371
-
372
-
373
-
374
-
375
-
376
-
377
-
378
-
379
-
380
-
381
-
382
-
383
-
384
-
385
-
386
-
387
-
388
-
389
-
390
 |
 |

309RBS Group Annual Report and Accounts 2009
Financial statements
Notes on the accounts
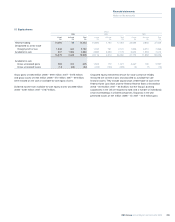
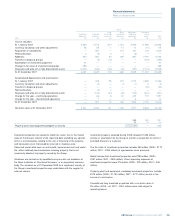
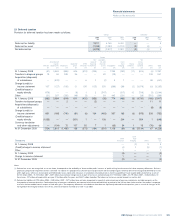
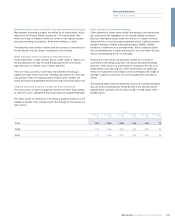
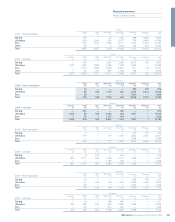
23 Deferred taxation
Provision for deferred taxation has been made as follows:
Group Company
2009 2008 2007 2009 2008 2007
£m £m £m £m £m £m
Deferred tax liability 2,811 4,165 5,400 ——3
Deferred tax asset (7,039) (7,082) (3,119) (2) (3) —
Net deferred tax (4,228) (2,917) 2,281 (2) (3) 3
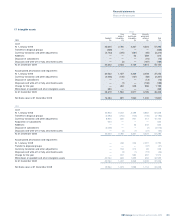
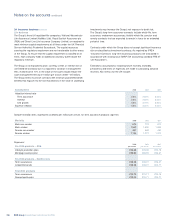
Group
Fair Available- Tax
Accelerated value of for-sale Cash losses
capital Deferred IFRS financial financial flow Share carried
Pension allowances Provisions gains transition instruments assets Intangibles hedging schemes forward Other Total
£m £m £m £m £m £m £m £m £m £m £m £m £m
At 1 January 2008 (51) 3,384 (886) 606 (619) (233) — 1,253 (252) (11) (904) (6) 2,281
Transfers to disposal groups 19 69 528 36 — — 80 (29) — — — 238 941
Acquisition/(disposals)
of subsidiaries — (509) — — 6 2 (2) 3 1 — — 58 (441)
Charge/(credit) to
income statement 157 (127) (106) 21 195 (125) 350 (898) 286 (2) (3,079) 63 (3,265)
(Credit)/charge to
equity directly (476) — — (6) 1 3 (547) — (317) 10 (709) (3) (2,044)
Other (31) 267 (350) (46) (3) — 84 445 (201) — (38) (516) (389)
At 1 January 2009 (382) 3,084 (814) 611 (420) (353) (35) 774 (483) (3) (4,730) (166) (2,917)
Transfers to disposal groups — — 2 — — (2) — — — — — 11 11
Acquisitions/(disposals)
of subsidiaries — — — — — — — — — — — (8) (8)
Charge/(credit) to
income statement 691 (165) (740) (81) (6) 164 (483) 397 165 (6) (973) 305 (732)
(Credit)/charge to
equity directly (1,033) — — (501) 1 — 126 — 204 — 554 1 (648)
Currency translation
and other adjustments — (104) 72 107 52 7 1 (63) 54 1 15 (76) 66
At 31 December 2009 (724) 2,815 (1,480) 136 (373) (184) (391) 1,108 (60) (8) (5,134) 67 (4,228)
Cash
IFRS flow Total
Company transition hedging Other £m
At 1 January 2008 — (2) 5 3
(Credit)/charge to income statement (4) 2 (5) (7)
Other 1—— 1
At 1 January 2009 (3) — — (3)
Charge to income statement 1—— 1
At 31 December 2009 (2) — — (2)
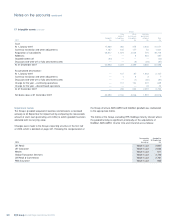
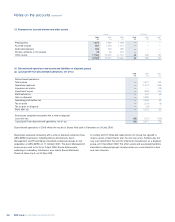
Notes:
(1) Deferred tax assets are recognised, as set out above, that depend on the availability of future taxable profits in excess of profits arising from the reversal of other temporary differences. Business
projections prepared for impairment reviews (see Note 17) indicate it is probable that sufficient future taxable income will be available against which to offset these recognised deferred tax assets
within eight years. UK losses do not expire and Netherlands losses expire after nine years. In jurisdictions where doubt exists over the availability of future taxable profits, deferred tax assets of
£2,163 million (2008 – £1,748 million; 2007 – £687 million) have not been recognised in respect of tax losses carried forward of £7,759 million (2008 – £5,779 million; 2007 – £2,043 million). Of
these losses, £27 million will expire within one year, £18 million within five years and £6,837 million thereafter. The balance of tax losses carried forward has no time limit.
(2) Deferred tax liabilities of £279 million (2008 – £980 million; 2007 – £977 million) have not been recognised in respect of retained earnings of overseas subsidiaries and held-over gains on the
incorporation of overseas branches. Retained earnings of overseas subsidiaries are expected to be reinvested indefinitely or remitted to the UK free from further taxation. No taxation is expected
to arise in the foreseeable future in respect of held-over gains. The temporary differences at the balance sheet date are significantly reduced from the previous year as a result of changes to UK
tax legislation which largely exempts from UK tax, overseas dividends received on or after 1 July 2009.