RBS 2009 Annual Report Download - page 353
Download and view the complete annual report
Please find page 353 of the 2009 RBS annual report below. You can navigate through the pages in the report by either clicking on the pages listed below, or by using the keyword search tool below to find specific information within the annual report.-
 1
1 -
2
-
3
-
4
-
5
-
6
-
7
-
8
-
9
-
10
-
11
-
12
-
13
-
14
-
15
-
16
-
17
-
18
-
19
-
20
-
21
-
22
-
23
-
24
-
25
-
26
-
27
-
28
-
29
-
30
-
31
-
32
-
33
-
34
-
35
-
36
-
37
-
38
-
39
-
40
-
41
-
42
-
43
-
44
-
45
-
46
-
47
-
48
-
49
-
50
-
51
-
52
-
53
-
54
-
55
-
56
-
57
-
58
-
59
-
60
-
61
-
62
-
63
-
64
-
65
-
66
-
67
-
68
-
69
-
70
-
71
-
72
-
73
-
74
-
75
-
76
-
77
-
78
-
79
-
80
-
81
-
82
-
83
-
84
-
85
-
86
-
87
-
88
-
89
-
90
-
91
-
92
-
93
-
94
-
95
-
96
-
97
-
98
-
99
-
100
-
101
-
102
-
103
-
104
-
105
-
106
-
107
-
108
-
109
-
110
-
111
-
112
-
113
-
114
-
115
-
116
-
117
-
118
-
119
-
120
-
121
-
122
-
123
-
124
-
125
-
126
-
127
-
128
-
129
-
130
-
131
-
132
-
133
-
134
-
135
-
136
-
137
-
138
-
139
-
140
-
141
-
142
-
143
-
144
-
145
-
146
-
147
-
148
-
149
-
150
-
151
-
152
-
153
-
154
-
155
-
156
-
157
-
158
-
159
-
160
-
161
-
162
-
163
-
164
-
165
-
166
-
167
-
168
-
169
-
170
-
171
-
172
-
173
-
174
-
175
-
176
-
177
-
178
-
179
-
180
-
181
-
182
-
183
-
184
-
185
-
186
-
187
-
188
-
189
-
190
-
191
-
192
-
193
-
194
-
195
-
196
-
197
-
198
-
199
-
200
-
201
-
202
-
203
-
204
-
205
-
206
-
207
-
208
-
209
-
210
-
211
-
212
-
213
-
214
-
215
-
216
-
217
-
218
-
219
-
220
-
221
-
222
-
223
-
224
-
225
-
226
-
227
-
228
-
229
-
230
-
231
-
232
-
233
-
234
-
235
-
236
-
237
-
238
-
239
-
240
-
241
-
242
-
243
-
244
-
245
-
246
-
247
-
248
-
249
-
250
-
251
-
252
-
253
-
254
-
255
-
256
-
257
-
258
-
259
-
260
-
261
-
262
-
263
-
264
-
265
-
266
-
267
-
268
-
269
-
270
-
271
-
272
-
273
-
274
-
275
-
276
-
277
-
278
-
279
-
280
-
281
-
282
-
283
-
284
-
285
-
286
-
287
-
288
-
289
-
290
-
291
-
292
-
293
-
294
-
295
-
296
-
297
-
298
-
299
-
300
-
301
-
302
-
303
-
304
-
305
-
306
-
307
-
308
-
309
-
310
-
311
-
312
-
313
-
314
-
315
-
316
-
317
-
318
-
319
-
320
-
321
-
322
-
323
-
324
-
325
-
326
-
327
-
328
-
329
-
330
-
331
-
332
-
333
-
334
-
335
-
336
-
337
-
338
-
339
-
340
-
341
-
342
-
 343
343 -
 344
344 -
 345
345 -
 346
346 -
 347
347 -
 348
348 -
 349
349 -
 350
350 -
 351
351 -
 352
352 -
 353
353 -
 354
354 -
 355
355 -
 356
356 -
 357
357 -
 358
358 -
 359
359 -
 360
360 -
 361
361 -
 362
362 -
 363
363 -
364
-
365
-
366
-
367
-
368
-
369
-
370
-
371
-
372
-
373
-
374
-
375
-
376
-
377
-
378
-
379
-
380
-
381
-
382
-
383
-
384
-
385
-
386
-
387
-
388
-
389
-
390
 |
 |

Additional information
351RBS Group Annual Report and Accounts 2009
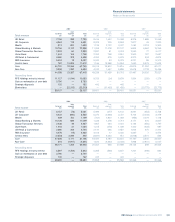
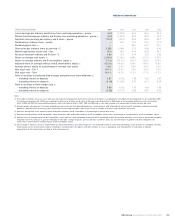
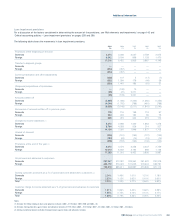
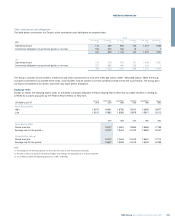
Other financial data 2009 2008 2007 2006 2005
(Loss)/earnings per ordinary and B share from continuing operations – pence (6.3) (146.2) 64.0 54.4 47.3
Diluted (loss)/earnings per ordinary and B share from continuing operations – pence (1) (6.3) (146.2) 63.4 53.9 47.0
Adjusted (loss)/earnings per ordinary and B share – pence (13.2) (43.1) 65.5 55.8 49.1
Dividends per ordinary share – pence — 19.3 27.0 21.6 17.0
Dividend payout ratio (2) —— 43% 45% 41%
Share price per ordinary share at year end – £ 0.292 0.494 3.72 5.56 4.90
Market capitalisation at year end – £bn 16.5 19.5 44.4 62.8 56.1
Net asset value per ordinary and B share – £ 0.65 1.15 3.74 3.24 2.83
Return on average total assets (3) (0.18%) (1.19%) 0.65% 0.74% 0.73%
Return on average ordinary and B shareholders’ equity (4) (7.2%) (50.1%) 18.7% 18.5% 17.5%
Adjusted return on average ordinary and B shareholders’ equity (5) (15.0%) (14.8%) 19.8% 18.8% 17.8%
Average owners’ equity as a percentage of average total assets 2.8% 2.9% 3.9% 4.4% 4.5%
Risk asset ratio – Tier 1 14.1% 10.0% 7.3% 7.5% 7.6%
Risk asset ratio – Total 16.1% 14.1% 11.2% 11.7% 11.7%
Ratio of earnings to combined fixed charges and preference share dividends (6)
– including interest on deposits 0.81 (0.29) 1.45 1.62 1.67
– excluding interest on deposits (0.19) (11.96) 5.73 6.12 6.05
Ratio of earnings to fixed charges only (6)
– including interest on deposits 0.85 (0.30) 1.47 1.64 1.69
– excluding interest on deposits (0.28) (14.71) 6.53 6.87 6.50
Notes:
(1) The number of ordinary shares in issue in prior years were adjusted retrospectively for the bonus element of the rights issue completed in June 2008 and the capitalisation issue in September 2008.
The contingent agreement with HM Treasury enabling it to place up to 16 billion new B shares at 50p each had a dilutive effect in 2009. None of the convertible preference shares had a dilutive
effect in 2009 and 2008. All the convertible preference shares had a dilutive effect in 2007, 2006 and 2005 and as such were included in the computation of diluted earnings per share.
(2) Dividend payout ratio represents the interim dividend paid and current year final dividend proposed as a percentage of profit attributable to ordinary and B shareholders before discontinued
operations, integration and restructuring costs, amortisation of purchased intangibles and net gain on sale of strategic investments and subsidiaries (net of tax).
(3) Return on average total assets represents profit attributable to ordinary and B shareholders as a percentage of average total assets.
(4) Return on average ordinary and B shareholders’ equity represents profit attributable to ordinary and B shareholders expressed as a percentage of average ordinary and B shareholders’ equity.
(5) Adjusted return on average ordinary and B shareholders’ equity represents profit attributable to ordinary and B shareholders before discontinued operations, amortisation of purchased intangibles,
integration and restructuring costs, gain on redemption of own debt, strategic disposals, gains on pensions curtailment, bonus tax and write-downs of goodwill and other intangible assets
expressed as a percentage of average ordinary and B shareholders’ equity.
(6) For this purpose, earnings consist of income before tax and minority interests, plus fixed charges less the unremitted income of associated undertakings (share of profits less dividends received).
Fixed charges consist of total interest expense, including or excluding interest on deposits and debt securities in issue, as appropriate, and the proportion of rental expense deemed
representative of the interest factor (one third of total rental expenses).