RBS 2009 Annual Report Download - page 180
Download and view the complete annual report
Please find page 180 of the 2009 RBS annual report below. You can navigate through the pages in the report by either clicking on the pages listed below, or by using the keyword search tool below to find specific information within the annual report.-
 1
1 -
2
-
3
-
4
-
5
-
6
-
7
-
8
-
9
-
10
-
11
-
12
-
13
-
14
-
15
-
16
-
17
-
18
-
19
-
20
-
21
-
22
-
23
-
24
-
25
-
26
-
27
-
28
-
29
-
30
-
31
-
32
-
33
-
34
-
35
-
36
-
37
-
38
-
39
-
40
-
41
-
42
-
43
-
44
-
45
-
46
-
47
-
48
-
49
-
50
-
51
-
52
-
53
-
54
-
55
-
56
-
57
-
58
-
59
-
60
-
61
-
62
-
63
-
64
-
65
-
66
-
67
-
68
-
69
-
70
-
71
-
72
-
73
-
74
-
75
-
76
-
77
-
78
-
79
-
80
-
81
-
82
-
83
-
84
-
85
-
86
-
87
-
88
-
89
-
90
-
91
-
92
-
93
-
94
-
95
-
96
-
97
-
98
-
99
-
100
-
101
-
102
-
103
-
104
-
105
-
106
-
107
-
108
-
109
-
110
-
111
-
112
-
113
-
114
-
115
-
116
-
117
-
118
-
119
-
120
-
121
-
122
-
123
-
124
-
125
-
126
-
127
-
128
-
129
-
130
-
131
-
132
-
133
-
134
-
135
-
136
-
137
-
138
-
139
-
140
-
141
-
142
-
143
-
144
-
145
-
146
-
147
-
148
-
149
-
150
-
151
-
152
-
153
-
154
-
155
-
156
-
157
-
158
-
159
-
160
-
161
-
162
-
163
-
164
-
165
-
166
-
167
-
168
-
169
-
 170
170 -
 171
171 -
 172
172 -
 173
173 -
 174
174 -
 175
175 -
 176
176 -
 177
177 -
 178
178 -
 179
179 -
 180
180 -
 181
181 -
 182
182 -
 183
183 -
 184
184 -
 185
185 -
 186
186 -
 187
187 -
 188
188 -
 189
189 -
 190
190 -
191
-
192
-
193
-
194
-
195
-
196
-
197
-
198
-
199
-
200
-
201
-
202
-
203
-
204
-
205
-
206
-
207
-
208
-
209
-
210
-
211
-
212
-
213
-
214
-
215
-
216
-
217
-
218
-
219
-
220
-
221
-
222
-
223
-
224
-
225
-
226
-
227
-
228
-
229
-
230
-
231
-
232
-
233
-
234
-
235
-
236
-
237
-
238
-
239
-
240
-
241
-
242
-
243
-
244
-
245
-
246
-
247
-
248
-
249
-
250
-
251
-
252
-
253
-
254
-
255
-
256
-
257
-
258
-
259
-
260
-
261
-
262
-
263
-
264
-
265
-
266
-
267
-
268
-
269
-
270
-
271
-
272
-
273
-
274
-
275
-
276
-
277
-
278
-
279
-
280
-
281
-
282
-
283
-
284
-
285
-
286
-
287
-
288
-
289
-
290
-
291
-
292
-
293
-
294
-
295
-
296
-
297
-
298
-
299
-
300
-
301
-
302
-
303
-
304
-
305
-
306
-
307
-
308
-
309
-
310
-
311
-
312
-
313
-
314
-
315
-
316
-
317
-
318
-
319
-
320
-
321
-
322
-
323
-
324
-
325
-
326
-
327
-
328
-
329
-
330
-
331
-
332
-
333
-
334
-
335
-
336
-
337
-
338
-
339
-
340
-
341
-
342
-
343
-
344
-
345
-
346
-
347
-
348
-
349
-
350
-
351
-
352
-
353
-
354
-
355
-
356
-
357
-
358
-
359
-
360
-
361
-
362
-
363
-
364
-
365
-
366
-
367
-
368
-
369
-
370
-
371
-
372
-
373
-
374
-
375
-
376
-
377
-
378
-
379
-
380
-
381
-
382
-
383
-
384
-
385
-
386
-
387
-
388
-
389
-
390
 |
 |

Business review continued
RBS Group Annual Report and Accounts 2009178
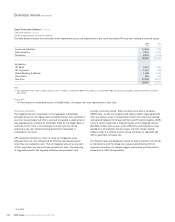
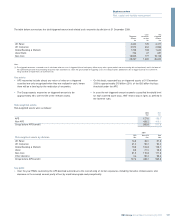
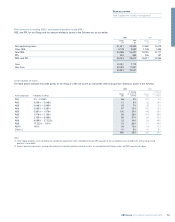
Asset Protection Scheme* continued
Covered assets continued
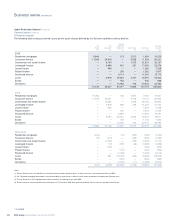
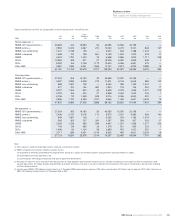
Divisional analysis
The following table analyses covered assets by the asset classes defined by the Scheme conditions and by division:
Global
UK UK Banking Covered
Retail Corporate & Markets Ulster Bank Non-Core amount
£m £m £m £m £m £m
2009
Residential mortgages 9,646 — 113 2,512 1,934 14,205
Consumer finance 11,596 24,818 — 5,538 11,309 53,261
Commercial real estate finance — 9,143 — 1,073 21,921 32,137
Leveraged finance — 4,899 621 291 17,465 23,276
Lease finance — 449 — — 1,080 1,529
Project finance — — 255 — 1,562 1,817
Structured finance — — 4,114 — 11,061 15,175
Loans — 9,918 25,815 2,237 16,972 54,942
Bonds — — 153 — 545 698
Derivatives — — 12,946 218 20,326 33,490
21,242 49,227 44,017 11,869 104,175 230,530
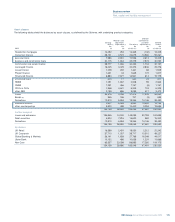
2008
Residential mortgages 10,280 — 128 2,837 2,182 15,427
Consumer finance 11,609 25,031 — 5,776 12,127 54,543
Commercial real estate finance — 12,436 — 1,268 26,146 39,850
Leveraged finance — 4,978 993 329 21,434 27,734
Lease finance — 594 — — 1,844 2,438
Project finance — — 425 — 1,818 2,243
Structured finance — — 6,897 - 12,294 19,191
Loans — 9,097 45,610 2,663 22,607 79,977
Bonds — — 455 — 1,108 1,563
Derivatives — — 16,349 229 22,415 38,993
21,889 52,136 70,857 13,102 123,975 281,959
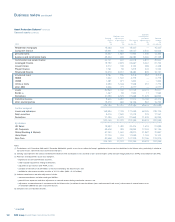
Movements
Residential mortgages (634) — (15) (325) (248) (1,222)
Consumer finance (13) (213) — (238) (818) (1,282)
Commercial real estate finance — (3,293) — (195) (4,225) (7,713)
Leveraged finance — (79) (372) (38) (3,969) (4,458)
Lease finance — (145) — — (764) (909)
Project finance — — (170) — (256) (426)
Structured finance — — (2,783) — (1,233) (4,016)
Loans — 821 (19,795) (426) (5,635) (25,035)
Bonds — — (302) — (563) (865)
Derivatives — — (3,403) (11) (2,089) (5,503)
(647) (2,909) (26,840) (1,233) (19,800) (51,429)
Notes:
(1) Per the Scheme rules, the definition of consumer finance includes personal loans, as well as business and commercial loans to SMEs
(2) UK Corporate leveraged finance does not include lending to sponsors but, reflects certain loans to corporate customers per Scheme rules.
(3) The net increase in UK Corporate loans reflects transfers of shipping assets from GBM.
(4) There have been some minor divisional refinements to 31 December 2008 data, primarily between Core businesses and Non-Core division.
* unaudited