RBS 2009 Annual Report Download - page 149
Download and view the complete annual report
Please find page 149 of the 2009 RBS annual report below. You can navigate through the pages in the report by either clicking on the pages listed below, or by using the keyword search tool below to find specific information within the annual report.-
 1
1 -
2
-
3
-
4
-
5
-
6
-
7
-
8
-
9
-
10
-
11
-
12
-
13
-
14
-
15
-
16
-
17
-
18
-
19
-
20
-
21
-
22
-
23
-
24
-
25
-
26
-
27
-
28
-
29
-
30
-
31
-
32
-
33
-
34
-
35
-
36
-
37
-
38
-
39
-
40
-
41
-
42
-
43
-
44
-
45
-
46
-
47
-
48
-
49
-
50
-
51
-
52
-
53
-
54
-
55
-
56
-
57
-
58
-
59
-
60
-
61
-
62
-
63
-
64
-
65
-
66
-
67
-
68
-
69
-
70
-
71
-
72
-
73
-
74
-
75
-
76
-
77
-
78
-
79
-
80
-
81
-
82
-
83
-
84
-
85
-
86
-
87
-
88
-
89
-
90
-
91
-
92
-
93
-
94
-
95
-
96
-
97
-
98
-
99
-
100
-
101
-
102
-
103
-
104
-
105
-
106
-
107
-
108
-
109
-
110
-
111
-
112
-
113
-
114
-
115
-
116
-
117
-
118
-
119
-
120
-
121
-
122
-
123
-
124
-
125
-
126
-
127
-
128
-
129
-
130
-
131
-
132
-
133
-
134
-
135
-
136
-
137
-
138
-
 139
139 -
 140
140 -
 141
141 -
 142
142 -
 143
143 -
 144
144 -
 145
145 -
 146
146 -
 147
147 -
 148
148 -
 149
149 -
 150
150 -
 151
151 -
 152
152 -
 153
153 -
 154
154 -
 155
155 -
 156
156 -
 157
157 -
 158
158 -
 159
159 -
160
-
161
-
162
-
163
-
164
-
165
-
166
-
167
-
168
-
169
-
170
-
171
-
172
-
173
-
174
-
175
-
176
-
177
-
178
-
179
-
180
-
181
-
182
-
183
-
184
-
185
-
186
-
187
-
188
-
189
-
190
-
191
-
192
-
193
-
194
-
195
-
196
-
197
-
198
-
199
-
200
-
201
-
202
-
203
-
204
-
205
-
206
-
207
-
208
-
209
-
210
-
211
-
212
-
213
-
214
-
215
-
216
-
217
-
218
-
219
-
220
-
221
-
222
-
223
-
224
-
225
-
226
-
227
-
228
-
229
-
230
-
231
-
232
-
233
-
234
-
235
-
236
-
237
-
238
-
239
-
240
-
241
-
242
-
243
-
244
-
245
-
246
-
247
-
248
-
249
-
250
-
251
-
252
-
253
-
254
-
255
-
256
-
257
-
258
-
259
-
260
-
261
-
262
-
263
-
264
-
265
-
266
-
267
-
268
-
269
-
270
-
271
-
272
-
273
-
274
-
275
-
276
-
277
-
278
-
279
-
280
-
281
-
282
-
283
-
284
-
285
-
286
-
287
-
288
-
289
-
290
-
291
-
292
-
293
-
294
-
295
-
296
-
297
-
298
-
299
-
300
-
301
-
302
-
303
-
304
-
305
-
306
-
307
-
308
-
309
-
310
-
311
-
312
-
313
-
314
-
315
-
316
-
317
-
318
-
319
-
320
-
321
-
322
-
323
-
324
-
325
-
326
-
327
-
328
-
329
-
330
-
331
-
332
-
333
-
334
-
335
-
336
-
337
-
338
-
339
-
340
-
341
-
342
-
343
-
344
-
345
-
346
-
347
-
348
-
349
-
350
-
351
-
352
-
353
-
354
-
355
-
356
-
357
-
358
-
359
-
360
-
361
-
362
-
363
-
364
-
365
-
366
-
367
-
368
-
369
-
370
-
371
-
372
-
373
-
374
-
375
-
376
-
377
-
378
-
379
-
380
-
381
-
382
-
383
-
384
-
385
-
386
-
387
-
388
-
389
-
390
 |
 |

Business review
Risk, capital and liquidity management
147RBS Group Annual Report and Accounts 2009
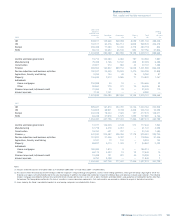
Movement in loan impairment provisions
The following table shows the movement in the provision for impairment losses for loans and advances.
Individually assessed Collectively 2009 2008 2007
Banks Customers assessed Latent Total Total Total
£m £m £m £m £m £m £m
Group before RFS Holdings minority interest
At 1 January 127 3,913 3,692 1,719 9,451 4,972 4,501
Transfers to disposal groups — (152) (111) (58) (321) ——
Currency translation and other adjustments (4) (263) (56) (105) (428) 1,007 72
Acquisition of subsidiaries —————— 129
Disposals — (65) — — (65) (178) —
Amounts written-off — (3,609) (2,869) — (6,478) (2,897) (1,914)
Recoveries of amounts previously written-off — 38 287 — 325 261 275
Charge to income statement (1) 34 7,878 3,994 1,184 13,090 6,478 2,082
Discount unwind — (239) (162) — (401) (192) (173)
At 31 December (2) 157 7,501 4,775 2,740 15,173 9,451 4,972
Group
At 1 January 127 4,843 4,102 1,944 11,016 6,452 3,935
Transfers to disposal groups — (155) (111) (58) (324) (767) —
Currency translation and other adjustments (4) (326) (78) (122) (530) 1,441 183
Acquisition of subsidiaries —————— 2,221
Disposals — (65) — — (65) (178) —
Amounts written-off — (3,940) (2,999) — (6,939) (3,148) (2,011)
Recoveries of amounts previously written-off — 94 305 — 399 319 342
Charge to income statement (1) 34 8,591 4,197 1,312 14,134 7,091 1,946
Discount unwind — (246) (162) — (408) (194) (164)
At 31 December (2) 157 8,796 5,254 3,076 17,283 11,016 6,452
Notes:
(1) Includes charge relating to loans and advances to banks of £34 million (2008 – £118 million; 2007 – nil).
(2) Includes closing provisions relating to loans and advances to banks of £157 million (2008 – £127 million; 2007 – £3 million).