RBS 2009 Annual Report Download - page 97
Download and view the complete annual report
Please find page 97 of the 2009 RBS annual report below. You can navigate through the pages in the report by either clicking on the pages listed below, or by using the keyword search tool below to find specific information within the annual report.-
 1
1 -
2
-
3
-
4
-
5
-
6
-
7
-
8
-
9
-
10
-
11
-
12
-
13
-
14
-
15
-
16
-
17
-
18
-
19
-
20
-
21
-
22
-
23
-
24
-
25
-
26
-
27
-
28
-
29
-
30
-
31
-
32
-
33
-
34
-
35
-
36
-
37
-
38
-
39
-
40
-
41
-
42
-
43
-
44
-
45
-
46
-
47
-
48
-
49
-
50
-
51
-
52
-
53
-
54
-
55
-
56
-
57
-
58
-
59
-
60
-
61
-
62
-
63
-
64
-
65
-
66
-
67
-
68
-
69
-
70
-
71
-
72
-
73
-
74
-
75
-
76
-
77
-
78
-
79
-
80
-
81
-
82
-
83
-
84
-
85
-
86
-
 87
87 -
 88
88 -
 89
89 -
 90
90 -
 91
91 -
 92
92 -
 93
93 -
 94
94 -
 95
95 -
 96
96 -
 97
97 -
 98
98 -
 99
99 -
 100
100 -
 101
101 -
 102
102 -
 103
103 -
 104
104 -
 105
105 -
 106
106 -
 107
107 -
108
-
109
-
110
-
111
-
112
-
113
-
114
-
115
-
116
-
117
-
118
-
119
-
120
-
121
-
122
-
123
-
124
-
125
-
126
-
127
-
128
-
129
-
130
-
131
-
132
-
133
-
134
-
135
-
136
-
137
-
138
-
139
-
140
-
141
-
142
-
143
-
144
-
145
-
146
-
147
-
148
-
149
-
150
-
151
-
152
-
153
-
154
-
155
-
156
-
157
-
158
-
159
-
160
-
161
-
162
-
163
-
164
-
165
-
166
-
167
-
168
-
169
-
170
-
171
-
172
-
173
-
174
-
175
-
176
-
177
-
178
-
179
-
180
-
181
-
182
-
183
-
184
-
185
-
186
-
187
-
188
-
189
-
190
-
191
-
192
-
193
-
194
-
195
-
196
-
197
-
198
-
199
-
200
-
201
-
202
-
203
-
204
-
205
-
206
-
207
-
208
-
209
-
210
-
211
-
212
-
213
-
214
-
215
-
216
-
217
-
218
-
219
-
220
-
221
-
222
-
223
-
224
-
225
-
226
-
227
-
228
-
229
-
230
-
231
-
232
-
233
-
234
-
235
-
236
-
237
-
238
-
239
-
240
-
241
-
242
-
243
-
244
-
245
-
246
-
247
-
248
-
249
-
250
-
251
-
252
-
253
-
254
-
255
-
256
-
257
-
258
-
259
-
260
-
261
-
262
-
263
-
264
-
265
-
266
-
267
-
268
-
269
-
270
-
271
-
272
-
273
-
274
-
275
-
276
-
277
-
278
-
279
-
280
-
281
-
282
-
283
-
284
-
285
-
286
-
287
-
288
-
289
-
290
-
291
-
292
-
293
-
294
-
295
-
296
-
297
-
298
-
299
-
300
-
301
-
302
-
303
-
304
-
305
-
306
-
307
-
308
-
309
-
310
-
311
-
312
-
313
-
314
-
315
-
316
-
317
-
318
-
319
-
320
-
321
-
322
-
323
-
324
-
325
-
326
-
327
-
328
-
329
-
330
-
331
-
332
-
333
-
334
-
335
-
336
-
337
-
338
-
339
-
340
-
341
-
342
-
343
-
344
-
345
-
346
-
347
-
348
-
349
-
350
-
351
-
352
-
353
-
354
-
355
-
356
-
357
-
358
-
359
-
360
-
361
-
362
-
363
-
364
-
365
-
366
-
367
-
368
-
369
-
370
-
371
-
372
-
373
-
374
-
375
-
376
-
377
-
378
-
379
-
380
-
381
-
382
-
383
-
384
-
385
-
386
-
387
-
388
-
389
-
390
 |
 |

95RBS Group Annual Report and Accounts 2009
Business review
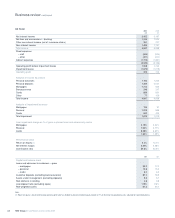
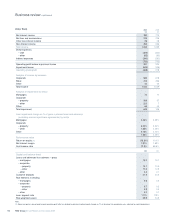
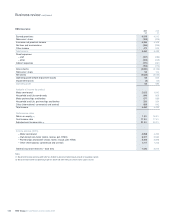
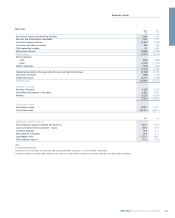
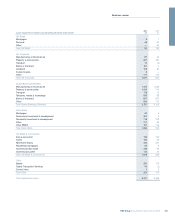
Global Transaction Services 2009 2008
£m £m
Net interest income 912 937
Non-interest income 1,575 1,494
Total income 2,487 2,431
Direct expenses
– staff (371) (362)
– other (161) (149)
Indirect expenses (943) (864)
(1,475) (1,375)
Operating profit before impairment losses 1,012 1,056
Impairment losses (39) (54)
Operating profit 973 1,002
Analysis of income by product
Domestic cash management 805 795
International cash management 734 722
Trade finance 290 241
Merchant acquiring 528 554
Commercial cards 130 119
Total income 2,487 2,431
Performance ratios
Net interest margin 9.22% 8.25%
Cost:income ratio 59.3% 56.6%
£bn £bn
Capital and balance sheet
Total third party assets 18.4 22.2
Loans and advances 12.7 14.8
Customer deposits 61.8 61.8
Risk elements in lending 0.2 0.1
Loan:deposit ratio 21% 25%
Risk-weighted assets 19.1 17.4
2009 compared with 2008
Operating profit declined by 3%, or 6% at constant foreign exchange
rates, largely reflecting pressure on deposit income. The attrition of
deposit balances experienced in the first half was reversed in the
second, but margins remain compressed due to both a very competitive
deposit market as well as the low rate environment.
Customer deposit balances at £61.8 billion were flat on the previous
year, with growth in the UK and international business offset by weaker
US domestic balances. At constant exchange rates balances were up
3%. Loans and advances were down 14% (11% in constant currency
terms) due to reduced overdraft utilisation and lower trade volumes.
At constant exchange rates, international payment fees increased by
11%, while trade finance income increased by 8%, with improved
penetration in the Asia-Pacific region. Merchant acquiring income,
however, declined by 9% at constant exchange rates, as consumers
continued to switch to lower margin debit card transactions in
preference to using credit cards.
Expenses were up 7% in headline terms but flat in constant currency
terms, as cost savings and efficiencies helped to mitigate the impact of
investment in infrastructure. Staff expenses were 2% lower in constant
currency terms, with headcount down 5%. The cost:income ratio was
59.3%, a deterioration of 2.7 percentage points or 1.9 percentage
points in constant currency terms.
Impairment losses were £39 million, down £15 million versus 2008.
Overall defaults remain modest at 0.3% of loans and advances.