RBS 2009 Annual Report Download - page 135
Download and view the complete annual report
Please find page 135 of the 2009 RBS annual report below. You can navigate through the pages in the report by either clicking on the pages listed below, or by using the keyword search tool below to find specific information within the annual report.-
 1
1 -
2
-
3
-
4
-
5
-
6
-
7
-
8
-
9
-
10
-
11
-
12
-
13
-
14
-
15
-
16
-
17
-
18
-
19
-
20
-
21
-
22
-
23
-
24
-
25
-
26
-
27
-
28
-
29
-
30
-
31
-
32
-
33
-
34
-
35
-
36
-
37
-
38
-
39
-
40
-
41
-
42
-
43
-
44
-
45
-
46
-
47
-
48
-
49
-
50
-
51
-
52
-
53
-
54
-
55
-
56
-
57
-
58
-
59
-
60
-
61
-
62
-
63
-
64
-
65
-
66
-
67
-
68
-
69
-
70
-
71
-
72
-
73
-
74
-
75
-
76
-
77
-
78
-
79
-
80
-
81
-
82
-
83
-
84
-
85
-
86
-
87
-
88
-
89
-
90
-
91
-
92
-
93
-
94
-
95
-
96
-
97
-
98
-
99
-
100
-
101
-
102
-
103
-
104
-
105
-
106
-
107
-
108
-
109
-
110
-
111
-
112
-
113
-
114
-
115
-
116
-
117
-
118
-
119
-
120
-
121
-
122
-
123
-
124
-
 125
125 -
 126
126 -
 127
127 -
 128
128 -
 129
129 -
 130
130 -
 131
131 -
 132
132 -
 133
133 -
 134
134 -
 135
135 -
 136
136 -
 137
137 -
 138
138 -
 139
139 -
 140
140 -
 141
141 -
 142
142 -
 143
143 -
 144
144 -
 145
145 -
146
-
147
-
148
-
149
-
150
-
151
-
152
-
153
-
154
-
155
-
156
-
157
-
158
-
159
-
160
-
161
-
162
-
163
-
164
-
165
-
166
-
167
-
168
-
169
-
170
-
171
-
172
-
173
-
174
-
175
-
176
-
177
-
178
-
179
-
180
-
181
-
182
-
183
-
184
-
185
-
186
-
187
-
188
-
189
-
190
-
191
-
192
-
193
-
194
-
195
-
196
-
197
-
198
-
199
-
200
-
201
-
202
-
203
-
204
-
205
-
206
-
207
-
208
-
209
-
210
-
211
-
212
-
213
-
214
-
215
-
216
-
217
-
218
-
219
-
220
-
221
-
222
-
223
-
224
-
225
-
226
-
227
-
228
-
229
-
230
-
231
-
232
-
233
-
234
-
235
-
236
-
237
-
238
-
239
-
240
-
241
-
242
-
243
-
244
-
245
-
246
-
247
-
248
-
249
-
250
-
251
-
252
-
253
-
254
-
255
-
256
-
257
-
258
-
259
-
260
-
261
-
262
-
263
-
264
-
265
-
266
-
267
-
268
-
269
-
270
-
271
-
272
-
273
-
274
-
275
-
276
-
277
-
278
-
279
-
280
-
281
-
282
-
283
-
284
-
285
-
286
-
287
-
288
-
289
-
290
-
291
-
292
-
293
-
294
-
295
-
296
-
297
-
298
-
299
-
300
-
301
-
302
-
303
-
304
-
305
-
306
-
307
-
308
-
309
-
310
-
311
-
312
-
313
-
314
-
315
-
316
-
317
-
318
-
319
-
320
-
321
-
322
-
323
-
324
-
325
-
326
-
327
-
328
-
329
-
330
-
331
-
332
-
333
-
334
-
335
-
336
-
337
-
338
-
339
-
340
-
341
-
342
-
343
-
344
-
345
-
346
-
347
-
348
-
349
-
350
-
351
-
352
-
353
-
354
-
355
-
356
-
357
-
358
-
359
-
360
-
361
-
362
-
363
-
364
-
365
-
366
-
367
-
368
-
369
-
370
-
371
-
372
-
373
-
374
-
375
-
376
-
377
-
378
-
379
-
380
-
381
-
382
-
383
-
384
-
385
-
386
-
387
-
388
-
389
-
390
 |
 |

Business review
Risk, capital and liquidity management
133RBS Group Annual Report and Accounts 2009
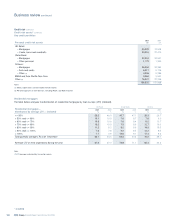
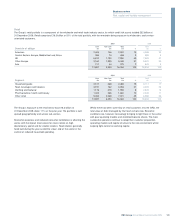
2009 2008
Core Non-Core Total % Total %
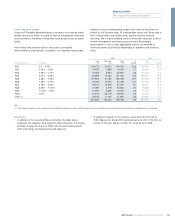
Asset quality band PD range £m £m £m of total £m of total
AQ1 0% – 0.03% 124,172 20,570 144,742 20.3 208,033 24.4
AQ2 0.03% – 0.05% 13,470 1,958 15,428 2.2 29,939 3.5
AQ3 0.05% – 0.10% 27,456 6,462 33,918 4.8 44,724 5.2
AQ4 0.10% – 0.38% 84,594 17,032 101,626 14.3 159,067 18.6
AQ5 0.38% – 1.08% 107,960 27,135 135,095 19.1 157,138 18.5
AQ6 1.08% – 2.15% 78,048 19,050 97,098 13.7 107,191 12.5
AQ7 2.15% – 6.09% 42,611 14,449 57,060 8.1 48,271 5.6
AQ8 6.09% – 17.22% 21,484 4,479 25,963 3.7 25,682 3.0
AQ9 17.22% – 100% 10,597 5,845 16,442 2.3 12,034 1.4
AQ10 100% 16,316 23,118 39,434 5.6 19,130 2.2
Other (1) 30,814 11,166 41,980 5.9 43,667 5.1
557,522 151,264 708,786 100 854,876 100
Note:
(1) ‘Other’ largely comprises assets covered by the standardised approach for which a PD equivalent to those assigned to assets covered by the internal ratings based approach is not available.
Key points
•In addition to the overall portfolio contraction, the table above
evidences the negative rating migration observed across the Group’s
portfolios during the course of 2009, with the lower quality bands
(AQ7 and below) all showing increased exposure.
•A significant majority of this increase occurred in the first half of
2009. Exposure in bands AQ7 and below grew by 23% in the first six
months of the year and by a further 6% since 30 June 2009.
Credit risk asset quality
Using the PD models described above, customers are assigned credit
grades and scores, which are used for internal management reporting
across portfolios, including a Group level asset quality scale, as shown
below.
Internal reporting and oversight of risk assets is principally
differentiated by credit grades. Customers are assigned credit grades,
based on various credit grading models that reflect the key drivers of
default for the customer type. All credit grades across the Group map to
both a Group level asset quality scale, used for external financial
reporting, and a master grading scale for wholesale exposures used for
internal management reporting across portfolios. Accordingly,
measurement of risk is easily aggregated and can be reported at
increasing levels of granularity depending on audience and business
need.