RBS 2009 Annual Report Download - page 266
Download and view the complete annual report
Please find page 266 of the 2009 RBS annual report below. You can navigate through the pages in the report by either clicking on the pages listed below, or by using the keyword search tool below to find specific information within the annual report.-
 1
1 -
2
-
3
-
4
-
5
-
6
-
7
-
8
-
9
-
10
-
11
-
12
-
13
-
14
-
15
-
16
-
17
-
18
-
19
-
20
-
21
-
22
-
23
-
24
-
25
-
26
-
27
-
28
-
29
-
30
-
31
-
32
-
33
-
34
-
35
-
36
-
37
-
38
-
39
-
40
-
41
-
42
-
43
-
44
-
45
-
46
-
47
-
48
-
49
-
50
-
51
-
52
-
53
-
54
-
55
-
56
-
57
-
58
-
59
-
60
-
61
-
62
-
63
-
64
-
65
-
66
-
67
-
68
-
69
-
70
-
71
-
72
-
73
-
74
-
75
-
76
-
77
-
78
-
79
-
80
-
81
-
82
-
83
-
84
-
85
-
86
-
87
-
88
-
89
-
90
-
91
-
92
-
93
-
94
-
95
-
96
-
97
-
98
-
99
-
100
-
101
-
102
-
103
-
104
-
105
-
106
-
107
-
108
-
109
-
110
-
111
-
112
-
113
-
114
-
115
-
116
-
117
-
118
-
119
-
120
-
121
-
122
-
123
-
124
-
125
-
126
-
127
-
128
-
129
-
130
-
131
-
132
-
133
-
134
-
135
-
136
-
137
-
138
-
139
-
140
-
141
-
142
-
143
-
144
-
145
-
146
-
147
-
148
-
149
-
150
-
151
-
152
-
153
-
154
-
155
-
156
-
157
-
158
-
159
-
160
-
161
-
162
-
163
-
164
-
165
-
166
-
167
-
168
-
169
-
170
-
171
-
172
-
173
-
174
-
175
-
176
-
177
-
178
-
179
-
180
-
181
-
182
-
183
-
184
-
185
-
186
-
187
-
188
-
189
-
190
-
191
-
192
-
193
-
194
-
195
-
196
-
197
-
198
-
199
-
200
-
201
-
202
-
203
-
204
-
205
-
206
-
207
-
208
-
209
-
210
-
211
-
212
-
213
-
214
-
215
-
216
-
217
-
218
-
219
-
220
-
221
-
222
-
223
-
224
-
225
-
226
-
227
-
228
-
229
-
230
-
231
-
232
-
233
-
234
-
235
-
236
-
237
-
238
-
239
-
240
-
241
-
242
-
243
-
244
-
245
-
246
-
247
-
248
-
249
-
250
-
251
-
252
-
253
-
254
-
255
-
 256
256 -
 257
257 -
 258
258 -
 259
259 -
 260
260 -
 261
261 -
 262
262 -
 263
263 -
 264
264 -
 265
265 -
 266
266 -
 267
267 -
 268
268 -
 269
269 -
 270
270 -
 271
271 -
 272
272 -
 273
273 -
 274
274 -
 275
275 -
 276
276 -
277
-
278
-
279
-
280
-
281
-
282
-
283
-
284
-
285
-
286
-
287
-
288
-
289
-
290
-
291
-
292
-
293
-
294
-
295
-
296
-
297
-
298
-
299
-
300
-
301
-
302
-
303
-
304
-
305
-
306
-
307
-
308
-
309
-
310
-
311
-
312
-
313
-
314
-
315
-
316
-
317
-
318
-
319
-
320
-
321
-
322
-
323
-
324
-
325
-
326
-
327
-
328
-
329
-
330
-
331
-
332
-
333
-
334
-
335
-
336
-
337
-
338
-
339
-
340
-
341
-
342
-
343
-
344
-
345
-
346
-
347
-
348
-
349
-
350
-
351
-
352
-
353
-
354
-
355
-
356
-
357
-
358
-
359
-
360
-
361
-
362
-
363
-
364
-
365
-
366
-
367
-
368
-
369
-
370
-
371
-
372
-
373
-
374
-
375
-
376
-
377
-
378
-
379
-
380
-
381
-
382
-
383
-
384
-
385
-
386
-
387
-
388
-
389
-
390
 |
 |

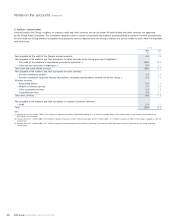
Notes on the accounts continued
RBS Group Annual Report and Accounts 2009264
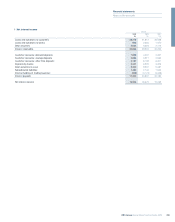
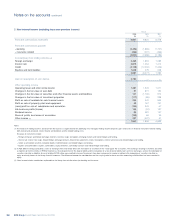
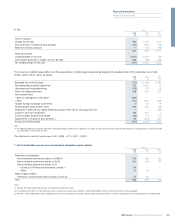
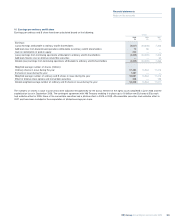
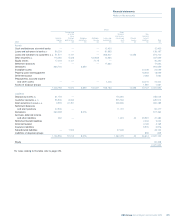
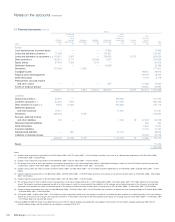
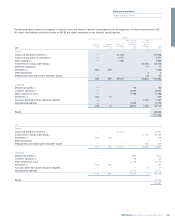
4 Pension costs continued
Main scheme All schemes
Present Present
value of Net value of Net
Fair value defined pension Fair value defined pension
of plan benefit deficit/ of plan benefit deficit/
assets obligations (surplus) assets obligations (surplus)
Changes in value of net pension deficit/(surplus) £m £m £m £m £m £m
At 1 January 2008 18,575 18,099 (476) 27,662 27,547 (115)
Transfers to disposal groups — — — (1) (49) (48)
Currency translation and other adjustments — — — 2,497 2,692 195
Income statement:
Expected return 1,271 (1,271) 1,865 (1,865)
Interest cost 1,080 1,080 1,622 1,622
Current service cost 437 437 705 705
Past service cost 21 21 28 28
1,271 1,538 267 1,865 2,355 490
Statement of comprehensive income:
Actuarial gains and losses (4,784) (3,389) 1,395 (6,051) (3,764) 2,287
Disposal of subsidiaries — — — (31) (34) (3)
Contributions by employer 396 — (396) 810 — (810)
Contributions by plan participants ——— 9 9—
Benefits paid (630) (630) — (978) (978) —
Expenses included in service cost (24) (24) — (26) (26) —
At 1 January 2009 14,804 15,594 790 25,756 27,752 1,996
Currency translation and other adjustments — — — (699) (813) (114)
Income statement
Expected return 1,029 (1,029) 1,553 (1,553)
Interest cost 999 999 1,614 1,614
Current service cost 300 300 583 583
Past service cost 15 15 15 15
Gains on curtailments (1,947) (1,947) (2,148) (2,148)
1,029 (633) (1,662) 1,553 64 (1,489)
Statement of comprehensive income
Actuarial gains and losses 993 4,473 3,480 1,344 5,009 3,665
Contributions by employer 536 — (536) 1,153 — (1,153)
Contributions by plan participants and other scheme members 2 2 — 15 15 —
Benefits paid (741) (741) — (1,175) (1,175) —
Expenses included in service cost (20) (20) — (22) (22) —
At 31 December 2009 16,603 18,675 2,072 27,925 30,830 2,905
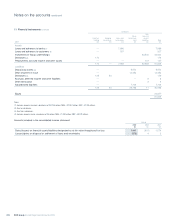
2009 2008 2007
Net pension deficit comprises: £m £m £m
Net assets of schemes in surplus (included in Prepayments, accrued income and other assets, Note 19) (58) (36) (575)
Net liabilities of schemes in deficit 2,963 2,032 460
2,905 1,996 (115)