RBS 2009 Annual Report Download - page 161
Download and view the complete annual report
Please find page 161 of the 2009 RBS annual report below. You can navigate through the pages in the report by either clicking on the pages listed below, or by using the keyword search tool below to find specific information within the annual report.-
 1
1 -
2
-
3
-
4
-
5
-
6
-
7
-
8
-
9
-
10
-
11
-
12
-
13
-
14
-
15
-
16
-
17
-
18
-
19
-
20
-
21
-
22
-
23
-
24
-
25
-
26
-
27
-
28
-
29
-
30
-
31
-
32
-
33
-
34
-
35
-
36
-
37
-
38
-
39
-
40
-
41
-
42
-
43
-
44
-
45
-
46
-
47
-
48
-
49
-
50
-
51
-
52
-
53
-
54
-
55
-
56
-
57
-
58
-
59
-
60
-
61
-
62
-
63
-
64
-
65
-
66
-
67
-
68
-
69
-
70
-
71
-
72
-
73
-
74
-
75
-
76
-
77
-
78
-
79
-
80
-
81
-
82
-
83
-
84
-
85
-
86
-
87
-
88
-
89
-
90
-
91
-
92
-
93
-
94
-
95
-
96
-
97
-
98
-
99
-
100
-
101
-
102
-
103
-
104
-
105
-
106
-
107
-
108
-
109
-
110
-
111
-
112
-
113
-
114
-
115
-
116
-
117
-
118
-
119
-
120
-
121
-
122
-
123
-
124
-
125
-
126
-
127
-
128
-
129
-
130
-
131
-
132
-
133
-
134
-
135
-
136
-
137
-
138
-
139
-
140
-
141
-
142
-
143
-
144
-
145
-
146
-
147
-
148
-
149
-
150
-
 151
151 -
 152
152 -
 153
153 -
 154
154 -
 155
155 -
 156
156 -
 157
157 -
 158
158 -
 159
159 -
 160
160 -
 161
161 -
 162
162 -
 163
163 -
 164
164 -
 165
165 -
 166
166 -
 167
167 -
 168
168 -
 169
169 -
 170
170 -
 171
171 -
172
-
173
-
174
-
175
-
176
-
177
-
178
-
179
-
180
-
181
-
182
-
183
-
184
-
185
-
186
-
187
-
188
-
189
-
190
-
191
-
192
-
193
-
194
-
195
-
196
-
197
-
198
-
199
-
200
-
201
-
202
-
203
-
204
-
205
-
206
-
207
-
208
-
209
-
210
-
211
-
212
-
213
-
214
-
215
-
216
-
217
-
218
-
219
-
220
-
221
-
222
-
223
-
224
-
225
-
226
-
227
-
228
-
229
-
230
-
231
-
232
-
233
-
234
-
235
-
236
-
237
-
238
-
239
-
240
-
241
-
242
-
243
-
244
-
245
-
246
-
247
-
248
-
249
-
250
-
251
-
252
-
253
-
254
-
255
-
256
-
257
-
258
-
259
-
260
-
261
-
262
-
263
-
264
-
265
-
266
-
267
-
268
-
269
-
270
-
271
-
272
-
273
-
274
-
275
-
276
-
277
-
278
-
279
-
280
-
281
-
282
-
283
-
284
-
285
-
286
-
287
-
288
-
289
-
290
-
291
-
292
-
293
-
294
-
295
-
296
-
297
-
298
-
299
-
300
-
301
-
302
-
303
-
304
-
305
-
306
-
307
-
308
-
309
-
310
-
311
-
312
-
313
-
314
-
315
-
316
-
317
-
318
-
319
-
320
-
321
-
322
-
323
-
324
-
325
-
326
-
327
-
328
-
329
-
330
-
331
-
332
-
333
-
334
-
335
-
336
-
337
-
338
-
339
-
340
-
341
-
342
-
343
-
344
-
345
-
346
-
347
-
348
-
349
-
350
-
351
-
352
-
353
-
354
-
355
-
356
-
357
-
358
-
359
-
360
-
361
-
362
-
363
-
364
-
365
-
366
-
367
-
368
-
369
-
370
-
371
-
372
-
373
-
374
-
375
-
376
-
377
-
378
-
379
-
380
-
381
-
382
-
383
-
384
-
385
-
386
-
387
-
388
-
389
-
390
 |
 |
Business review
Risk, capital and liquidity management
159RBS Group Annual Report and Accounts 2009
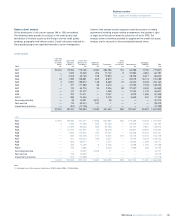
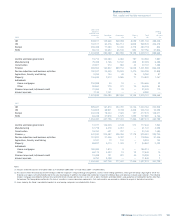
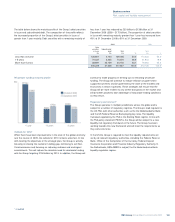
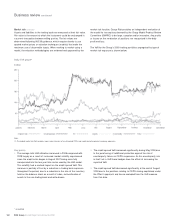
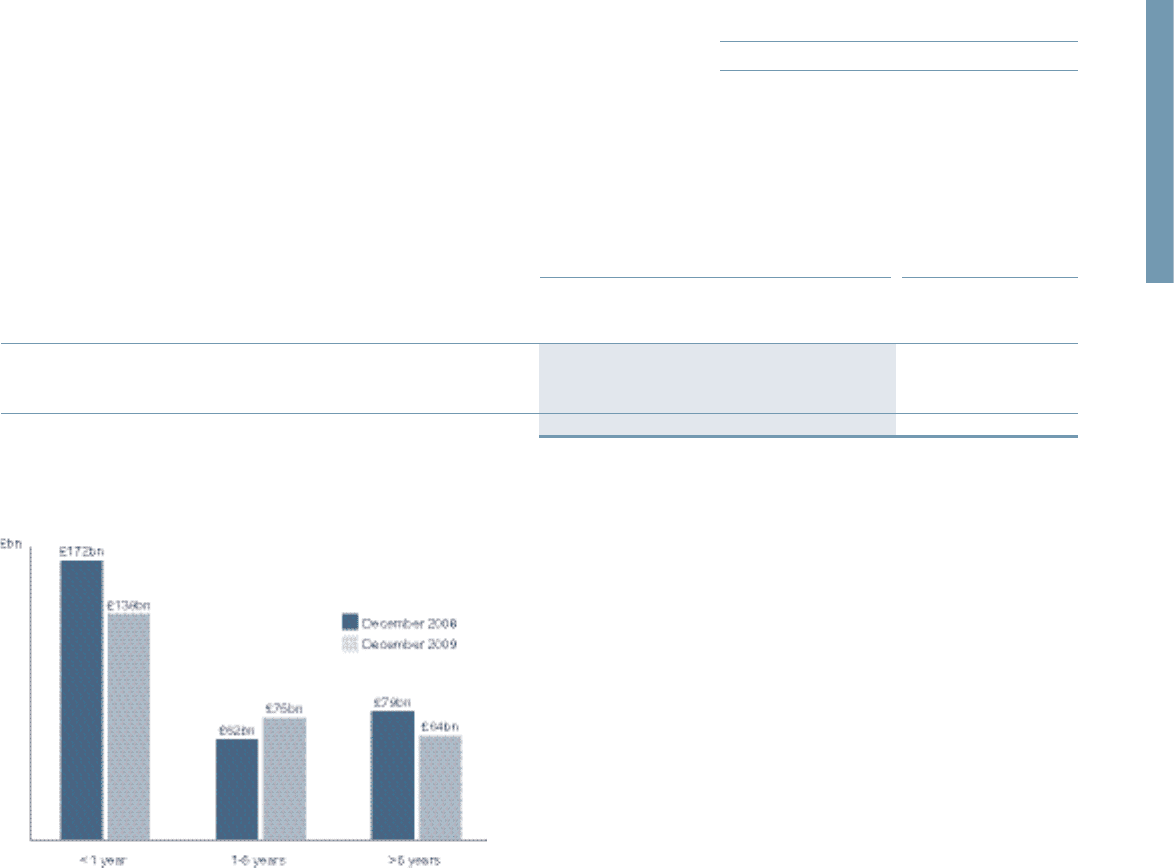
Wholesale funding maturity profile
Outlook for 2010*
Whilst there have been improvements in the state of the global economy
over the course of 2009, the outlook for 2010 remains uncertain. In line
with meeting the objectives of the strategic plan, the Group is actively
focusing on closing the customer funding gap, continuing to exit Non-
Core businesses and focusing on reducing undrawn and contingent
commitments. This will reduce the absolute need for wholesale funding
with the Group targeting £150 billion by 2013. In addition, the Group will
continue to make progress in terming out its remaining wholesale
funding. The Group will continue to reduce reliance on government
supported schemes and be governed by the state of the markets and
economies in which it operates. These strategies will ensure that the
Group will be more resilient to any further disruptions in the market and
will be better placed to take advantage of favourable trading conditions
as they return.
Regulatory environment*
The Group operates in multiple jurisdictions across the globe and is
subject to a number of regulatory regimes. The Group’s lead regulator is
the UK FSA, with other authorities such as the De Nederlandsche Bank
and the US Federal Reserve Bank playing key roles. The liquidity
framework applied by the FSA is the Sterling Stock regime. In line with
the FSA policy statement PS09/16, the Group will be subject to a new
liquidity risk regulatory framework in the future. The Group has been
working towards this new framework and will meet the requirements as
they come into force.
In the US the Group is required to meet the liquidity requirements set
out by all relevant regulatory authorities, including the Federal Reserve
Bank, Office of the Comptroller of the Currency, Federal Deposit
Insurance Corporation and Financial Industry Regulatory Authority. In
the Netherlands, ABN AMRO is subject the De Nederlandsche Bank
liquidity regulation regime.
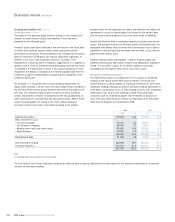
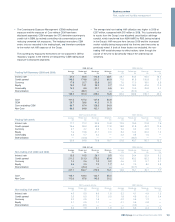
2009 2008
Debt
securities Subordinated
in issue debt Total Total
£m £m £m % £m %
Less than one year 136,901 2,144 139,045 50.0 172,234 55.0
1-5 years 70,437 4,235 74,672 26.9 61,842 19.8
More than 5 years 38,991 25,159 64,150 23.1 79,060 25.2
246,329 31,538 277,867 100.0 313,136 100.0
The table below shows the maturity profile of the Group’s debt securities
in issue and subordinated debt. The composition of the profile reflects
the increased proportion of the Group’s debt securities in issue of
greater than 1 year maturity. Debt securities with a remaining maturity of
less than 1 year has reduced by £33 billion to £139 billion at 31
December 2009 (2008 – £172 billion). The proportion of debt securities
in issue with remaining maturity greater than 1 year has increased from
45% at 31 December 2008 to 50% at 31 December 2009.
* unaudited