RBS 2009 Annual Report Download - page 158
Download and view the complete annual report
Please find page 158 of the 2009 RBS annual report below. You can navigate through the pages in the report by either clicking on the pages listed below, or by using the keyword search tool below to find specific information within the annual report.-
 1
1 -
2
-
3
-
4
-
5
-
6
-
7
-
8
-
9
-
10
-
11
-
12
-
13
-
14
-
15
-
16
-
17
-
18
-
19
-
20
-
21
-
22
-
23
-
24
-
25
-
26
-
27
-
28
-
29
-
30
-
31
-
32
-
33
-
34
-
35
-
36
-
37
-
38
-
39
-
40
-
41
-
42
-
43
-
44
-
45
-
46
-
47
-
48
-
49
-
50
-
51
-
52
-
53
-
54
-
55
-
56
-
57
-
58
-
59
-
60
-
61
-
62
-
63
-
64
-
65
-
66
-
67
-
68
-
69
-
70
-
71
-
72
-
73
-
74
-
75
-
76
-
77
-
78
-
79
-
80
-
81
-
82
-
83
-
84
-
85
-
86
-
87
-
88
-
89
-
90
-
91
-
92
-
93
-
94
-
95
-
96
-
97
-
98
-
99
-
100
-
101
-
102
-
103
-
104
-
105
-
106
-
107
-
108
-
109
-
110
-
111
-
112
-
113
-
114
-
115
-
116
-
117
-
118
-
119
-
120
-
121
-
122
-
123
-
124
-
125
-
126
-
127
-
128
-
129
-
130
-
131
-
132
-
133
-
134
-
135
-
136
-
137
-
138
-
139
-
140
-
141
-
142
-
143
-
144
-
145
-
146
-
147
-
 148
148 -
 149
149 -
 150
150 -
 151
151 -
 152
152 -
 153
153 -
 154
154 -
 155
155 -
 156
156 -
 157
157 -
 158
158 -
 159
159 -
 160
160 -
 161
161 -
 162
162 -
 163
163 -
 164
164 -
 165
165 -
 166
166 -
 167
167 -
 168
168 -
169
-
170
-
171
-
172
-
173
-
174
-
175
-
176
-
177
-
178
-
179
-
180
-
181
-
182
-
183
-
184
-
185
-
186
-
187
-
188
-
189
-
190
-
191
-
192
-
193
-
194
-
195
-
196
-
197
-
198
-
199
-
200
-
201
-
202
-
203
-
204
-
205
-
206
-
207
-
208
-
209
-
210
-
211
-
212
-
213
-
214
-
215
-
216
-
217
-
218
-
219
-
220
-
221
-
222
-
223
-
224
-
225
-
226
-
227
-
228
-
229
-
230
-
231
-
232
-
233
-
234
-
235
-
236
-
237
-
238
-
239
-
240
-
241
-
242
-
243
-
244
-
245
-
246
-
247
-
248
-
249
-
250
-
251
-
252
-
253
-
254
-
255
-
256
-
257
-
258
-
259
-
260
-
261
-
262
-
263
-
264
-
265
-
266
-
267
-
268
-
269
-
270
-
271
-
272
-
273
-
274
-
275
-
276
-
277
-
278
-
279
-
280
-
281
-
282
-
283
-
284
-
285
-
286
-
287
-
288
-
289
-
290
-
291
-
292
-
293
-
294
-
295
-
296
-
297
-
298
-
299
-
300
-
301
-
302
-
303
-
304
-
305
-
306
-
307
-
308
-
309
-
310
-
311
-
312
-
313
-
314
-
315
-
316
-
317
-
318
-
319
-
320
-
321
-
322
-
323
-
324
-
325
-
326
-
327
-
328
-
329
-
330
-
331
-
332
-
333
-
334
-
335
-
336
-
337
-
338
-
339
-
340
-
341
-
342
-
343
-
344
-
345
-
346
-
347
-
348
-
349
-
350
-
351
-
352
-
353
-
354
-
355
-
356
-
357
-
358
-
359
-
360
-
361
-
362
-
363
-
364
-
365
-
366
-
367
-
368
-
369
-
370
-
371
-
372
-
373
-
374
-
375
-
376
-
377
-
378
-
379
-
380
-
381
-
382
-
383
-
384
-
385
-
386
-
387
-
388
-
389
-
390
 |
 |
Business review continued
RBS Group Annual Report and Accounts 2009156
Funding and liquidity risk continued
Monitoring continued
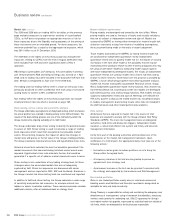
Undrawn commitments: The Group has been actively managing down
the amount of undrawn commitments that it is exposed to. Undrawn
commitments decreased from £349 billion at 31 December 2008 to
£289 billion at 31 December 2009.
Repo Agreements: At 31 December 2009 the Group had £68 billion of
customer secured funding and £38 billion of bank secured funding,
which includes borrowing using central bank funding schemes. With
markets continuing to stabilise through the course of 2009, the Group
has significantly reduced its reliance on secured funding from central
bank liquidity schemes.
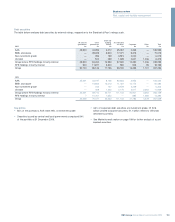
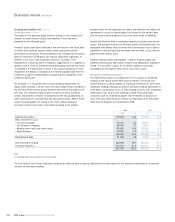
Liquidity reserves: The total stock of liquid assets has increased by
£81 billion during 2009 from £90 billion at 31 December 2008 to
£171 billion at 31 December 2009; this reflects the injection of
£25.5 billion of B shares at the end of December 2009 provided as
treasury bills and cash. The Group is targeting a liquidity pool of £150
billion by 2013. The table below shows the breakdown of these assets.
In addition to available liquid assets, the Group has a pool of
unencumbered assets that are available for securitisation to raise funds
if and when required.
The types of assets which can be used in securitisation include lending
assets, and the Group benefits from not having encumbered significant
amounts of lending assets historically.
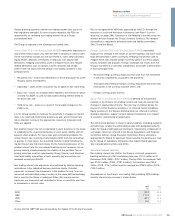
Conduit commitments: The Group has taken additional measures to
improve the balance sheet structure. One area of focus has been
reducing the size of the multi-seller conduits business, which relies
upon funding assets through the issuance of short term asset-backed
commercial paper. Total facilities have declined by £17.9 billion to £25.0
billion at 31 December 2009. This has reduced the liquidity risk to the
Group through the commitments provided for this type of business.
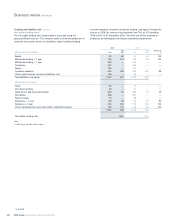
2009 2008
Liquidity reserves £m £m
Government securities 57,407 27,303
Cash and central bank balances 51,500 11,830
Unencumbered collateral (1) 42,055 30,054
Other liquid assets 19,699 20,647
Total liquidity reserve 170,661 89,834
Note:
(1) Includes secured assets which are eligible for discounting at central banks.
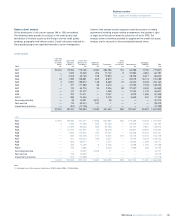
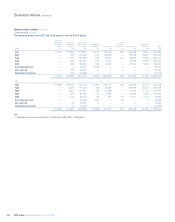
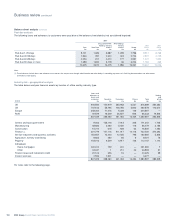
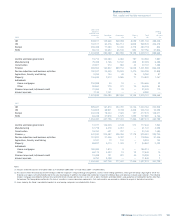
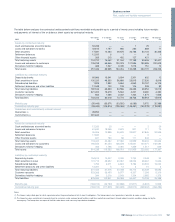
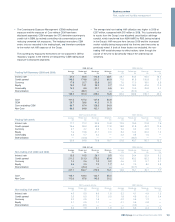
Funding profile
The contractual maturity of on balance sheet assets and liabilities,
shown in the tables overleaf, highlight the maturity transformation which
underpins the role of banks to lend longer-term but funded
predominantly by short-term liabilities such as customer deposits. This
is achieved through the diversified funding franchise of the Group
across an extensive retail, wealth and SME customer base, and across
a wide geographic network. In practice, the behavioural profile of many
assets and liabilities exhibit greater stability and longer maturity than the
contractual maturity. The Group models the behavioural maturity of
liabilities so that it can target a diversified and stable funding base.