RBS 2010 Annual Report Download
Download and view the complete annual report
Please find the complete 2010 RBS annual report below. You can navigate through the pages in the report by either clicking on the pages listed below, or by using the keyword search tool below to find specific information within the annual report.-
 1
1 -
 2
2 -
 3
3 -
 4
4 -
 5
5 -
 6
6 -
 7
7 -
 8
8 -
 9
9 -
 10
10 -
 11
11 -
 12
12 -
13
-
14
-
15
-
16
-
17
-
18
-
19
-
20
-
21
-
22
-
23
-
24
-
25
-
26
-
27
-
28
-
29
-
30
-
31
-
32
-
33
-
34
-
35
-
36
-
37
-
38
-
39
-
40
-
41
-
42
-
43
-
44
-
45
-
46
-
47
-
48
-
49
-
50
-
51
-
52
-
53
-
54
-
55
-
56
-
57
-
58
-
59
-
60
-
61
-
62
-
63
-
64
-
65
-
66
-
67
-
68
-
69
-
70
-
71
-
72
-
73
-
74
-
75
-
76
-
77
-
78
-
79
-
80
-
81
-
82
-
83
-
84
-
85
-
86
-
87
-
88
-
89
-
90
-
91
-
92
-
93
-
94
-
95
-
96
-
97
-
98
-
99
-
100
-
101
-
102
-
103
-
104
-
105
-
106
-
107
-
108
-
109
-
110
-
111
-
112
-
113
-
114
-
115
-
116
-
117
-
118
-
119
-
120
-
121
-
122
-
123
-
124
-
125
-
126
-
127
-
128
-
129
-
130
-
131
-
132
-
133
-
134
-
135
-
136
-
137
-
138
-
139
-
140
-
141
-
142
-
143
-
144
-
145
-
146
-
147
-
148
-
149
-
150
-
151
-
152
-
153
-
154
-
155
-
156
-
157
-
158
-
159
-
160
-
161
-
162
-
163
-
164
-
165
-
166
-
167
-
168
-
169
-
170
-
171
-
172
-
173
-
174
-
175
-
176
-
177
-
178
-
179
-
180
-
181
-
182
-
183
-
184
-
185
-
186
-
187
-
188
-
189
-
190
-
191
-
192
-
193
-
194
-
195
-
196
-
197
-
198
-
199
-
200
-
201
-
202
-
203
-
204
-
205
-
206
-
207
-
208
-
209
-
210
-
211
-
212
-
213
-
214
-
215
-
216
-
217
-
218
-
219
-
220
-
221
-
222
-
223
-
224
-
225
-
226
-
227
-
228
-
229
-
230
-
231
-
232
-
233
-
234
-
235
-
236
-
237
-
238
-
239
-
240
-
241
-
242
-
243
-
244
-
245
-
246
-
247
-
248
-
249
-
250
-
251
-
252
-
253
-
254
-
255
-
256
-
257
-
258
-
259
-
260
-
261
-
262
-
263
-
264
-
265
-
266
-
267
-
268
-
269
-
270
-
271
-
272
-
273
-
274
-
275
-
276
-
277
-
278
-
279
-
280
-
281
-
282
-
283
-
284
-
285
-
286
-
287
-
288
-
289
-
290
-
291
-
292
-
293
-
294
-
295
-
296
-
297
-
298
-
299
-
300
-
301
-
302
-
303
-
304
-
305
-
306
-
307
-
308
-
309
-
310
-
311
-
312
-
313
-
314
-
315
-
316
-
317
-
318
-
319
-
320
-
321
-
322
-
323
-
324
-
325
-
326
-
327
-
328
-
329
-
330
-
331
-
332
-
333
-
334
-
335
-
336
-
337
-
338
-
339
-
340
-
341
-
342
-
343
-
344
-
345
-
346
-
347
-
348
-
349
-
350
-
351
-
352
-
353
-
354
-
355
-
356
-
357
-
358
-
359
-
360
-
361
-
362
-
363
-
364
-
365
-
366
-
367
-
368
-
369
-
370
-
371
-
372
-
373
-
374
-
375
-
376
-
377
-
378
-
379
-
380
-
381
-
382
-
383
-
384
-
385
-
386
-
387
-
388
-
389
-
390
-
391
-
392
-
393
-
394
-
395
-
396
-
397
-
398
-
399
-
400
-
401
-
402
-
403
-
404
-
405
-
406
-
407
-
408
-
409
-
410
-
411
-
412
-
413
-
414
-
415
-
416
-
417
-
418
-
419
-
420
-
421
-
422
-
423
-
424
-
425
-
426
-
427
-
428
-
429
-
430
-
431
-
432
-
433
-
434
-
435
-
436
-
437
-
438
-
439
-
440
-
441
-
442
-
443
-
444
-
445
 |
 |

rbs.com
Annual Report and Accounts 2010
Table of contents
-
Page 1
Annual Report and Accounts 2010 rbs.com -
Page 2
... Our approach to risk management 32 34 36 38 40 41 Divisional review UK Retail UK Corporate Wealth Global Transaction Services Ulster Bank US Retail & Commercial Global Banking & Markets RBS Insurance Business Services and Central Functions Non-Core Division Asset Protection Scheme (APS) 42 44... -
Page 3
...(1) Group operating profit/(loss) before tax, amortisation of purchased intangible assets, integration and restructuring costs, gain on redemption of own debt, strategic disposals, bonus tax, Asset Protection Scheme credit default swap - fair value changes, gains on pensions curtailment, write-down... -
Page 4
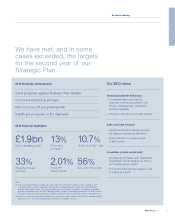
... our share of the mortgage and savings markets in the UK, with account numbers rising by 44,000 and 579,000, respectively. We are investing heavily in our core businesses, with a strong emphasis on serving customers better and improving our efficiency. Economic backdrop - getting better The global... -
Page 5
... programmes. Our annual Sustainability Report contains extensive information on our activities in this key area for us in the UK, USA, India and many other countries where we operate. Value for our shareholders It is vital that we make a proper financial return on the large amounts of new capital... -
Page 6
...-to-deposit ratio is 117%, down from 154% at peak and our Core businesses now take in over £1 of deposits for every £1 of loans Two years on from the global financial crisis, our recovery is ahead of schedule. In 2010 we made big strides in risk reduction and an early return to operating profits... -
Page 7
... itself. 2010 results were a large improvement on 2009 and our budgets for the year. At Group level RBS posted £1.9 billion of operating profits, excluding fair value of own debt (from a £6.1 billion loss in 2009). It was only after the post tax effect of APS (£1.1 billion) that we reported a net... -
Page 8
... in 2010, reflecting improvements in the economic environment. Impairments fell in all core businesses, except Ulster Bank, where asset default levels and loss rates remained high in both the retail and corporate portfolios, reflecting difficult economic conditions in Ireland. We currently expect... -
Page 9
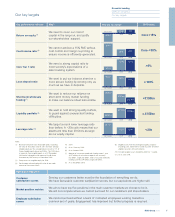
... system. We want to put our balance sheet on a more secure footing by lending only as much as we have in deposits. We want to reduce our reliance on short-term money market funding to make our balance sheet less volatile. 10.7% >8% 4%(5) worst point 2009 2010 154%(6) 135% Loan:deposit ratio... -
Page 10
Our business and our strategy Our approach to business Progress on our strategic plan Our core businesses The economic environment 8 RBS Group 2010 -
Page 11
... risk management Our over-riding focus is on achieving three things: to serve customers well; to restore the Bank to undoubted standalone strength; and to rebuild sustainable value for all shareholders. In the second year of our five-year plan, we made progress on all three counts. RBS Group 2010... -
Page 12
...protects our reputation We work within all relevant laws and regulations We are a responsible and engaged member of the community We conduct our business in a sustainable manner We deliver essential customer services and critical business processes at all times People We value our people We recruit... -
Page 13
... and data We operate our processes, systems and controls to minimise loss from fraud or error Finances We manage our finances carefully We use the Group's capital and resources efficiently We account for and report our transactions properly Risk We understand and manage the risks we are taking... -
Page 14
...businesses and asset portfolios while maximising the value obtained for the Group. RBS management hallmarks to include an open, investorfriendly approach, discipline and proven execution effectiveness, strong risk management and central focus on the customer Publish targets for risk/return balance... -
Page 15
... strongest global peers Group loan:deposit ratio of c.100% Short-term wholesale funding 8% Retail and commercial businesses generated around 51% of the Core operating profit for 2010, moving towards the achievement of... -
Page 16
...Loan:deposit ratio (%) UK Corporate We are the leading provider of banking, finance and risk management services to the corporate and SME sector. We offer a full range of banking products and related financial services. Return on equity (%) Cost:income ratio (%) Loan:deposit ratio (%) 2009 2010... -
Page 17
... top five banks in New England. Return on equity (%) Cost:income ratio (%) Loan:deposit ratio (%) Global Banking & Markets We provide financing, risk management and advisory services to major corporations, financial institutions and public sector clients in 39 countries. RBS Insurance We sell and... -
Page 18
...cent in 2009. However, a fall in activity in the final quarter of 2010 served as a timely reminder that, while conditions are generally improving, the recovery is fragile. The recovery has helped many of our customers. Company trading profits grew for the first time since 2008. The unemployment rate... -
Page 19
...to the Plan. These are to: Operating model The risk and liquidity balance sheet management strategies are owned and set by the Group's Board of directors, and implemented by executive management led by the Group Chief Executive. A number of committees supports the execution of the business plan and... -
Page 20
... centrally-managed liquidity portfolio (£155 billion). We have continued to enhance our market risk management framework. We have reduced trading and banking book exposures (with asset sales and write-downs within Non-Core and banking book available-for-sale assets in Core). In our motor business... -
Page 21
.... Volatile funding position caused by the uncertainty of future investment returns and the projected value of schemes' liabilities. The economic environment improved but continued to impact the level of operational risk in areas such as the scale of structural change occurring across the Group... -
Page 22
Divisional review UK Retail UK Corporate Wealth Global Transaction Services Ulster Bank US Retail & Commercial Global Banking & Markets RBS Insurance 20 RBS Group 2010 -
Page 23
...Core business is an asset to our customers, shareholders and risk profile - even before cross-business synergies are taken into account. The changes we are making to strengthen the Core business further can drive RBS to success as a leading bank in its markets for many years to come. RBS Group 2010... -
Page 24
... account against the progress we make, publishing an independentlyassured report on our performance every six months. 10% growth in customer deposits £1,372m operating profit Return on equity (%) Cost:income (%) Loan:deposit ratio (%) 2010 2013 target 18 >15 52 c.50 110 -
Page 25
...2011 to be another challenging year but we know that we will succeed as a business by helping our customers through good times and bad. Our commitment to becoming Britain's most Helpful and Sustainable Bank is a long-term one and we are confident we are creating a new kind of retail bank. RBS Group... -
Page 26
... costs. Helping businesses to start-up and grow We know that new businesses are vital to the recovering UK economy. In 2010, we opened on average more than 2,200 start-up accounts per week. Each one benefits from free transactional banking services in their first two years of operation. We launched... -
Page 27
... 5,000 loans to UK businesses each week. Our approval rate remains high: we continue to accept over 85% of the credit applications we receive. For the period from March 2010 to February 2011, RBS Group had agreed to make £50 billion of gross new lending facilities available to customers through its... -
Page 28
... Rory Tapner Chief Executive, Wealth Performance highlights Net interest income Non-interest income Total income Expenses Operating profit before impairment losses Impairment losses Operating profit Risk-weighted assets (£bn) Net interest margin Cost:income ratio Loan:deposit ratio 2010 £m 2009... -
Page 29
...Service awards, with a Jersey employee winning 'Frontline Professional of the Year'. In addition, two RBS International products, Autopilot and Navigator, won the Innovation Award in the 2010 Investment Life and Pensions Moneyfacts awards. Supporting good causes In 2010, the Coutts Charitable Trust... -
Page 30
...Group. Leveraging our global network GTS processes over 4.6 billion worldwide payments per year in 43 different currencies and we administer 4,600 global trade transactions each day. We use our international branch network to help customers do more business in more countries. We established a new UK... -
Page 31
... RMB accounts, currency exchange and trade finance services. For financial institutions, we unveiled the new Euro Trade Deduct product that maximises the benefits available from our cash and trade services. The launch of the RBS SWIFT Service Bureau throughout our Global Payments network enables... -
Page 32
...debt problems; and • local support, including no branch closures, a community fund and a 'Give a Day' volunteering programme. 8% increase in customer deposit balances in constant currencies 45 branches opened on Saturday for the first time Return on equity (%) Cost:income ratio (%) Loan:deposit... -
Page 33
... about what customers can expect concerning the costs, terms and conditions of credit and the factors that influence the price of a loan; and • understanding and support for businesses, including two-year free transactional banking for start-ups and an on-line business support programme. We are... -
Page 34
...make payments. We also Performance highlights Net interest income Non-interest income Total income Expenses Operating profit before impairment losses Impairment losses Operating profit/(loss) Risk-weighted assets (£bn) Return on equity Net interest margin Cost:income ratio Loan:deposit ratio 2010... -
Page 35
... sale to Advent International and Bain Capital, RBS will retain a 19.9% stake in the business, and can refer its customers to them for global merchant products and services. In May 2010, we also completed the exit of our joint arrangement with Kroger Personal Finance. Strengthening risk management... -
Page 36
...of own debt Fair value of own debt Operating profit Risk-weighted assets (£bn) Return on equity Net interest margin Cost:income ratio Loan:deposit ratio 2010 £m 2009 £m "Only by truly understanding our clients' needs can we apply our expertise to its best effect. That is why long-term customer... -
Page 37
...for derivatives (2010 Risk Interdealer Poll). Our debt capital markets business was voted Euromoney Best Debt House in the UK and the Netherlands. The Banker magazine gave us the Deal of the Year award for equities and sovereign bonds in Europe, financial institutions in the Middle East and loans in... -
Page 38
...in our underlying financial performance in the final quarter. 2009 £m Performance highlights Insurance net premium income Total income Expenses Net claims Impairment losses Investment income Operating (loss)/profit Return on equity Expense ratio Combined operating ratio 2010 £m 4,311 4,092 (703... -
Page 39
...on issues such as the risks of flood. Our dedication to customers, innovative products and hard working employees was recognised through a variety of awards in 2010. We received three 'Your Money' awards, with Direct Line winning for the Best Online Travel Insurance, Churchill for Best Pet Insurance... -
Page 40
...helped to launch similar products across other areas of the Group. Technology Services runs a programme to deliver innovative solutions, which includes building its own RBS 'App Store' to develop new business applications that boost productivity and enhance customer value. Managing operational risks... -
Page 41
... Finance Our Group Strategy and Corporate Finance team supports the Chief Executive, Chief Financial Officer and the Executive Committee in the development of the Group's strategy. Its objective is to ensure that the Group has the right portfolio of businesses, active in the right markets, supported... -
Page 42
...Asset Management business and for our Invoice Finance businesses in Germany and France. We completed the transfer of assets in six Asian countries to ANZ Group. 62% fall in operating losses 4 wholesale country exits in the year • Portfolio & Banking agreed deals to dispose of non-core portfolio... -
Page 43
... Plan (2012-13), subject to regulatory approval. Rory Cullinan Head of Non-Core Division Maximising shareholder value We achieved a significant reduction in the division's operating loss from £14.6 billion in 2009 to £5.5 billion, largely due to improvements in income from trading activities... -
Page 44
Sustainability 42 RBS Group 2010 -
Page 45
... sustainability In addition, we have a number of targeted community programmes that enable us to enhance our contribution to society. We aim to invest Group resources to maximise our impact, creating real and sustainable benefits in the communities in which we operate. RBS Group 2010 43 -
Page 46
... Chief Executive Officers of a number of our divisions. The GSC reviews the Group's overall sustainability strategy, values and policies. The Group Sustainability Forum is a network of senior managers from each division that makes sure we put into practice the priorities the GSC sets. The executive... -
Page 47
...12-19 year olds. The 2nd annual RBS Personal Finance Education Awards for Schools recognised the 2010 achievements of primary and secondary schools. Safety and security Protecting the security of our customers' money and data is a fundamental responsibility of the Group. We have continued to invest... -
Page 48
... in during work time. We run the activities through nine charities so that our employees can deliver the skills, services or fundraising that they need. This year 4,100 employees engaged in 225 activities. Our Global Banking and Markets division launched a new, bespoke volunteering programme across... -
Page 49
...in. The Group supported those efforts financially and by giving employees almost 170,000 hours off work to volunteer. Highlights of how we focus action across our businesses Fair banking Products and services The Group Customer Charter set out 14 clear commitments to our UK retail customers in 2010... -
Page 50
Report and accounts 48 RBS Group 2010 -
Page 51
... review 50 52 53 54 55 56 57 62 77 Presentation of information Forward-looking statements Description of business Competition Risk factors Key financials Summary consolidated income statement Analysis of results Divisional performance 106 Consolidated balance sheet 111 Cash flow 112 Capital... -
Page 52
... report as it more closely reflects the basis on which the Group is managed. 'UK' in this context includes domestic transactions and transactions conducted through the offices in the UK which service international banking transactions. The results, assets and liabilities of individual business units... -
Page 53
... costs; gain on redemption of own debt; strategic disposals; bonus tax; Asset Protection Scheme credit default swap - fair value changes; gains on pensions curtailment; write-down of goodwill and other intangible assets; and other Consortium Members' interest in shared assets. RBS Group 2010 51 -
Page 54
...; general operational risks; insurance claims; reputational risk; general geopolitical and economic conditions in the UK and in other countries in which the Group has significant business activities or investments, including the United States; the ability to achieve revenue benefits and cost savings... -
Page 55
... and equity financing, risk management and investment services to its customers. The division is organised along six principal business lines: money markets; rates flow trading; currencies and commodities; equities; credit and mortgage markets and portfolio management & origination. RBS Insurance... -
Page 56
... RBS Insurance, 80.01% of Global Merchant Services and substantially all of RBS Sempra Commodities JV business, as well as divesting the RBS branch-based business in England and Wales and the NatWest branches in Scotland, along with the Direct SME customers across the UK. Competition The Group... -
Page 57
... affect the Group's business, results of operations and financial condition and give rise to increased operational risk and may impair the Group's ability to raise new Tier 1 capital due to restrictions on its ability to make discretionary dividend or coupon payments on certain securities. The Group... -
Page 58
Business review continued Key financials Pro forma Statutory 2008 £m 2010 £m 2009 £m 2008 £m for the year ended 31 December Total income (1) Operating profit/(loss) before impairment losses and fair value of own debt (2) Loss before tax (3) Loss attributable to ordinary and B shareholders ... -
Page 59
... on redemption of own debt Strategic disposals Bonus tax Gains on pensions curtailment Asset Protection Scheme credit default swap - fair value changes Write-down of goodwill and other intangible assets Adjusted earnings/(loss) per ordinary and B share from continuing operations 14,200 8,194 (2,211... -
Page 60
Business review continued 2010 compared with 2009 - pro forma Operating profit/(loss) Group operating profit, excluding fair value of own debt, amortisation of purchased intangible assets, integration and restructuring costs, gain on redemption of own debt, strategic disposals, bonus tax, gains on... -
Page 61
... problem loans was 46% (2009 - 45%). Tax The tax charge for 2010 was £634 million compared with a tax credit of £429 million in 2009. Earnings Basic earnings per ordinary share, including discontinued operations, was a loss of 0.5p per share compared with a loss of 6.4p for 2009. RBS Group 2010... -
Page 62
Business review continued 2009 compared with 2008 - pro forma Operating loss Group operating loss, excluding fair value of own debt, amortisation of purchased intangible assets, write-down of goodwill and other intangible assets, integration and restructuring costs, gain on redemption of own debt,... -
Page 63
... loans was 45% (2008 - 51%). Tax The Group recorded a tax credit of £429 million in 2009, compared with a tax credit of £2,167 million in 2008. Earnings Basic earnings per ordinary and B share, including discontinued operations, improved from a loss of 146.7p to a loss of 6.4p. RBS Group 2010... -
Page 64
... (2009 - £350 million increase; 2008 - £860 million increase) to record interest on financial assets and liabilities designated as at fair value through profit or loss. Related interest-earning assets and interest-bearing liabilities have also been adjusted. (3) Gross yield is the interest rate... -
Page 65
Business review Average balance sheet and related interest Pro forma 2010 Average balance £m Interest £m Rate % Average balance £m Pro forma 2009 Interest £m Rate % Assets Loans and advances to banks Loans and advances to customers Debt securities Interest-earning assets Total interest-earning... -
Page 66
... - Overseas Customer accounts: other time deposits - UK - Overseas Debt securities in issue - UK - Overseas Subordinated liabilities - UK - Overseas Internal funding of trading business - UK - Overseas - UK Interest-bearing liabilities - Overseas Total interest-bearing liabilities - banking business... -
Page 67
...savings deposits - UK - Overseas Customer accounts: other time deposits - UK - Overseas Debt securities in issue - UK - Overseas Subordinated liabilities - UK - Overseas Internal funding of trading business - UK - Overseas - UK Interest-bearing liabilities - Overseas - banking business (2,3,6) Total... -
Page 68
...(2,3) Total assets Percentage of assets applicable to overseas operations Liabilities Deposits by banks Customer accounts: demand deposits Customer accounts: savings deposits Customer accounts: other time deposits Debt securities in issue Subordinated liabilities Internal funding of trading business... -
Page 69
...: savings deposits UK Overseas Customer accounts: other time deposits UK Overseas Debt securities in issue UK Overseas Subordinated liabilities UK Overseas Internal funding of trading business UK Overseas Total interest payable of the banking business UK Overseas Movement in net interest income UK... -
Page 70
...: savings deposits UK Overseas Customer accounts: other time deposits UK Overseas Debt securities in issue UK Overseas Subordinated liabilities UK Overseas Internal funding of trading business UK Overseas Total interest payable of the banking business UK Overseas Movement in net interest income UK... -
Page 71
Business review Non-interest income 2010 £m Pro forma (1) 2009 £m 2008 £m 2010 £m Statutory 2009 £m 2008 £m Fees and commissions receivable Fees and commissions payable Income/(loss) from trading activities - excluding Asset Protection Scheme credit default swap - fair value changes - Asset ... -
Page 72
... of 2009 the Group recorded a gain of £3,790 million on a liability management exercise to redeem a number of Tier 1 and upper Tier 2 securities. Other operating income decreased by £1,280 million. This reflected changes in the fair value of own debt of £926 million together with lower profits on... -
Page 73
...the £2.5 billion target for 2011 and are forecast to exceed £3 billion by 2013. Staff costs, excluding pension schemes curtailment gains, fell by £322 million to £9,671 million, driven by savings in Global Banking & Markets, UK Retail and Non-Core partially offset by higher costs in Group Centre... -
Page 74
... RBS systems. Accruals in relation to integration costs are set out below. 2009 compared with 2008 Integration costs in 2009 were £859 million compared with £1,050 million in 2008. Integration costs decreased primarily due to lower RBS N.V. (formerly ABN AMRO) integration activity during the year... -
Page 75
... relation to divestment costs are set out below. At 31 December 2009 £m Charge to income statement £m Utilised during the year £m At 31 December 2010 £m Staff costs - redundancy Staff costs - other Premises and equipment Other - - - - - 28 23 6 25 82 (6) (15) (6) (23) (50) 22 8 - 2 32 RBS... -
Page 76
Business review continued Impairment losses 2010 £m Pro forma 2009 £m 2008 £m 2010 £m Statutory 2009 £m 2008 £m New impairment losses Less: recoveries of amounts previously written-off Charge to income statement Comprising: Loans and advances Securities Charge to income statement 9,667 (... -
Page 77
... CDPCs (2) Asset-backed products Other credit exotics Equities Leveraged finance Banking book hedges Other Net credit and other market losses Notes: (1) Included in 'Income from trading activities', significantly all in Non-Core. (2) Credit derivative product companies. 2010 £m 2009 £m 2008... -
Page 78
... Risk and balance sheet management Financial statements Financial statements Financial statements Sub-section Other risk exposures Note 12 Financial instruments - valuation Critical accounting policies Note 11 Financial instruments - classification Page 204 310 284 306 Tax 2010 £m Pro forma 2009... -
Page 79
... assets (RWAs). 2010 £m 2009 £m 2008 £m UK Retail UK Corporate Wealth Global Transaction Services Ulster Bank US Retail & Commercial Retail & Commercial Global Banking & Markets RBS Insurance Central items Core Non-Core Operating profit/(loss) before fair value of own debt Fair value... -
Page 80
...2.08 2010 2009 £bn 2008 £bn Risk-weighted assets by division UK Retail UK Corporate Wealth Global Transaction Services Ulster Bank US Retail & Commercial Retail & Commercial Global Banking & Markets Other Core Non-Core Group before benefit of Asset Protection Scheme Benefit of Asset Protection... -
Page 81
Business review Employee numbers at 31 December (full time equivalents in continuing operations rounded to the nearest hundred) 2010 2009 2008 UK Retail UK Corporate Wealth Global Transaction Services Ulster Bank US Retail & Commercial Retail & Commercial Global Banking & Markets RBS Insurance ... -
Page 82
Business review continued UK Retail 2010 £m 2009 £m 2008 £m Net interest income Net fees and commissions Other non-interest income (net of insurance claims) Non-interest income Total income Direct expenses - staff costs - other Indirect expenses Operating profit before impairment losses ... -
Page 83
...in 2010 on growing secured lending while at the same time building customer deposits, thereby reducing the Group's reliance on wholesale funding. Loans and advances to customers grew 5%, with a change in mix from unsecured to secured as the Group actively sought to improve its risk profile. Mortgage... -
Page 84
...) on a total book of £83.2 billion. Mortgage arrears rates stabilised in the second half of 2009 and remain well below the industry average, as reported by the Council of Mortgage Lenders. Repossessions show only a small increase on 2008, as the Group continues to support customers facing financial... -
Page 85
Business review UK Corporate 2010 £m 2009 £m 2008 £m Net interest income Net fees and commissions Other non-interest income Non-interest income Total income Direct expenses - staff - other Indirect expenses Operating profit before impairment losses Impairment losses Operating profit Analysis of... -
Page 86
Business review continued UK Corporate continued 2010 £bn 2009 £bn 2008 £bn Capital and balance sheet Total third party assets Loans and advances to customers (gross) - banks and financial institutions - hotels and restaurants - housebuilding and construction - manufacturing - other - private ... -
Page 87
Business review Wealth 2010 £m 2009 £m 2008 £m Net interest income Net fees and commissions Other non-interest income Non-interest income Total income Direct expenses - staff costs - other Indirect expenses Operating profit before impairment losses Impairment losses Operating profit Analysis of... -
Page 88
... constant exchange rates during 2009, with investors turning to more liquid assets and away from longer term investments. Loans and advances increased by 10% over 2008, primarily in the UK. Lending margins improved, particularly for mortgages, and credit metrics for new business remain satisfactory... -
Page 89
Business review Global Transaction Services 2010 £m 2009 £m 2008 £m Net interest income Non-interest income Total income Direct expenses - staff costs - other Indirect expenses Operating profit before impairment losses Impairment losses Operating profit Analysis of income by product Domestic ... -
Page 90
Business review continued Global Transaction Services continued 2010 compared with 2009 Operating profit increased 12%, or 10% on a constant foreign exchange basis, driven by a robust income performance (which has more than compensated for the loss of Global Merchant Services (GMS) income), good ... -
Page 91
Business review Ulster Bank 2010 £m 2009 £m 2008 £m Net interest income Net fees and commissions Other non-interest income Non-interest income Total income Direct expenses - staff - other Indirect expenses Operating profit before impairment losses Impairment losses Operating (loss)/profit ... -
Page 92
Business review continued Ulster Bank continued 2010 £bn 2009 £bn 2008 £bn Capital and balance sheet Loans and advances to customers (gross) - mortgages - corporate - property - other corporate - other lending Customer deposits Risk elements in lending - mortgages - corporate - property - ... -
Page 93
... asset values. Sectors driven by consumer spending have been affected by the double digit decline in 2009 with rising default rates evident. Customer account numbers increased by 3% during 2009, with growth fuelled by strong current account activity and new-to-bank savings customers. RBS Group 2010... -
Page 94
...$m 2008 US$m 2010 £m 2009 £m 2008 £m Net interest income Net fees and commissions Other non-interest income Non-interest income Total income Direct expenses - staff - other Indirect expenses Operating profit before impairment losses Impairment losses Operating profit/(loss) Average exchange rate... -
Page 95
Business review 2010 US$bn 2009 US$bn 2008 US$bn 2010 £bn 2009 £bn 2008 £bn Capital and balance sheet Total third party assets Loans and advances to customers (gross) - residential mortgages - home equity - corporate and commercial - other consumer Customer deposits (excluding repos) Risk ... -
Page 96
Business review continued Global Banking & Markets 2010 £m 2009 £m 2008 £m Net interest income from banking activities Net fees and commissions receivable Income from trading activities Other operating income (net of related funding costs) Non-interest income Total income Direct expenses - ... -
Page 97
Business review 2010 £bn 2009 £bn 2008 £bn Capital and balance sheet Loans and advances to customers Loans and advances to banks Reverse repos Securities Cash and eligible bills Other Total third party assets (excluding derivatives mark-to-market) Net derivative assets (after netting) ... -
Page 98
... constant exchange rates, compared with 31 December 2008, driven by a 43% reduction in loans and advances as customers took advantage of favourable capital market conditions to raise alternative forms of finance to bank debt. This reduction was partially offset by an increase in liquid assets. Risk... -
Page 99
...2009 £m 2008 £m Earned premiums Reinsurers' share Net premium income Fees and commissions Instalment income Other income Total income Net claims Underwriting profit Staff expenses Other expenses Total direct expenses Indirect expenses Technical result Impairment losses Investment income Operating... -
Page 100
Business review continued RBS Insurance continued 2010 2009 2008 Performance ratios Return on equity (3) Loss ratio (4) Commission ratio (5) Expense ratio (6) Combined operating ratio (7) Balance sheet General insurance reserves - total (£m) (7.9%) 92% 10% 13% 115% 7,559 1.7% 84% 9% 14% 106% ... -
Page 101
Business review 2009 compared with 2008 Operating profit was severely affected by the rising costs of bodily injury claims, declining to £58 million. Significant price increases were implemented in the latter part of the year to mitigate the industry trend of rising claims costs. Income grew by ... -
Page 102
Business review continued Central items 2010 £m 2009 £m 2008 £m Central items not allocated before fair value of own debt Fair value of own debt Central items not allocated Note: (1) Costs/charges are denoted by brackets. 577 35 612 385 (93) 292 150 875 1,025 Funding and operating costs ... -
Page 103
Business review Non-Core 2010 £m 2009 £m 2008 £m Net interest income Net fees and commissions Loss from trading activities Insurance net premium income Other operating income - rental income - other (1) Non-interest income Total income Direct expenses - staff - operating lease depreciation - ... -
Page 104
Business review continued Non-Core continued 2010 £m 2009 £m 2008 £m (Loss)/income from trading activities Monoline exposures Credit derivative product companies Asset-backed products (1) Other credit exotics Equities Leveraged finance Banking book hedges Other (2) (5) (139) 235 77 (17) - (82... -
Page 105
...infrastructure Property and construction Transport Telecoms, media & technology Banks and financials Other Total Global Banking & Markets Other Wealth Global Transaction Services Central items Total Other Total impairment losses 2010 £m 2009 £m 2008 £m 5 8 - 13 6 47 - 53 1 42 62 105 26 437... -
Page 106
... Transport Telecoms, media and technology Banks and financials Other Total Global Banking & Markets Other Wealth Global Transaction Services RBS Insurance Central items Total Other Gross loans and advances to customers (excluding reverse repurchase agreements) 2010 £bn 2009 £bn 2008 £bn... -
Page 107
Business review 2010 compared with 2009 By the end of 2010 third party assets (excluding derivatives) had decreased to £138 billion, £5 billion lower than the end of year target, as a result of a successful disposal strategy, managed portfolio run-off and impairments. 2010 operating losses in Non... -
Page 108
..., accrued income and other assets Assets of disposal groups Total assets Liabilities Bank deposits Repurchase agreements and stock lending Deposits by banks Customers deposits Repurchase agreements and stock lending Customer accounts Debt securities in issue Settlement balances Short positions... -
Page 109
... December 2010 were down £69.8 billion, 5%, compared with 31 December 2009. This principally reflects the continuing planned disposal of Non-Core assets, together with a reduction in the level of debt securities and mark-to-market value of derivatives in Global Banking & Markets. Cash and balances... -
Page 110
...-Core assets, together with a reduction in the level of debt securities and the mark-to-market value of derivatives. Cash and balances at central banks were up £4.8 billion, 9%, to £57.0 billion principally due to an improvement in the Group's structural liquidity position during 2010. Loans and... -
Page 111
.... Debt securities in issue were down £23.1 billion, 9% to £246.3 billion, mainly as a result of movements in exchange rates together with reductions in Global Banking & Markets and Non-Core. Retirement benefit liabilities increased by £1.2 billion, 74%, to £2.7 billion, with net actuarial losses... -
Page 112
...interest, up £20.6 billion. Debt securities in issue were down £32.7 billion, 11% to £267.6 billion mainly as a result of movements in exchange rates, together with reductions in Global Banking & Markets, Non-Core and the RFS Holdings minority interest. Retirement benefit liabilities increased by... -
Page 113
Business review Cash flow 2010 £m 2009 £m 2008 £m Net cash flows from operating activities Net cash flows from investing activities Net cash flows from financing activities Effects of exchange rate changes on cash and cash equivalents Net increase/(decrease) in cash and cash equivalents 19,291... -
Page 114
... 46,500 36,900 695,800 n/a 695,800 Banking book: On-balance sheet Off-balance sheet Trading book 480,200 84,600 44,200 609,000 % % % % 318,600 59,400 22,300 400,300 % Risk asset ratios Core Tier 1 Tier 1 Total Note: (1) The data for 2010, 2009 and 2008 are on a Basel II basis; prior periods are... -
Page 115
... AMRO as well as the transfers of businesses to the other Consortium Members occurred on 1 January 2008. Group operating profit/(loss) on a pro forma basis excludes: x x x x x x gain on redemption of own debt; strategic disposals; bonus tax; Asset Protection Scheme credit default swap - fair value... -
Page 116
... income Total income Operating expenses Profit before other operating charges Insurance net claims Operating profit before impairment losses Impairment losses Operating loss before fair value of own debt Fair value of own debt Operating loss Amortisation of purchased intangible assets Integration... -
Page 117
...-interest income Total income Operating expenses Profit/(loss) before other operating charges Insurance net claims Operating loss before impairment losses Impairment losses Operating loss before fair value of own debt Fair value of own debt Operating loss Amortisation of purchased intangible assets... -
Page 118
..., accrued income and other assets Assets of disposal groups Total assets Liabilities Bank deposits Repurchase agreements and stock lending Deposits by banks Customer deposits Repurchase agreements and stock lending Customer accounts Debt securities in issue Settlement balances Short positions... -
Page 119
..., accrued income and other assets Assets of disposal groups Total assets Liabilities Bank deposits Repurchase agreements and stock lending Deposits by banks Customer deposits Repurchase agreements and stock lending Customer accounts Debt securities in issue Settlement balances Short positions... -
Page 120
..., accrued income and other assets Assets of disposal groups Total assets Liabilities Bank deposits Repurchase agreements and stock lending Deposits by banks Customer deposits Repurchase agreements and stock lending Customer accounts Debt securities in issue Settlement balances Short positions... -
Page 121
... strategy â- Group policy framework â- Capital/risk adjusted performance Risk architecture â- Risk, finance and treasury architecture â- Risk data quality â- Analytics and modelling â- Risk information and reporting Operating Model Deliver 5 year plan with strong risk and balance sheet... -
Page 122
Business review continued Introduction* continued Governance Risk and balance sheet management strategies are owned and set by the Group's Board of directors, and implemented by executive management led by the Group Chief Executive. There are a number of committees and executives that support the ... -
Page 123
... level by a risk governance structure embedded in the businesses. During 2010, Risk Management has been enhanced by the appointment of a Deputy Chief Risk Officer to whom the Divisional CROs and the functional risk heads now report. Committee Group Board Executive Committee (ExCo) Board Risk... -
Page 124
... of Balance Sheet Management, Group Treasury Global Head of Markets Head of Non-Core division Head of Restructuring and Risk Deputy Chief Risk Officer Group Chief Credit Officer Global Head of: Market and Insurance Risk; Operational Risk; Country Risk and Firm Wide Risk Director, Group Finance Chief... -
Page 125
... of term debt issuance. Asset quality has broadly stabilised, resulting in total loan impairments 33% lower than in 2009. However, weakness in the Irish economy and falling property values have resulted in the doubling of Ulster Bank Group impairments (Core and Non-Core) in 2010. Markets have... -
Page 126
... defined benefit pension schemes. Volatile funding position caused by the uncertainty of future investment returns and the projected value of schemes' liabilities. In 2010, the Group established the Group Corporate Sustainability Committee, and also developed a framework for managing environmental... -
Page 127
... actually happen in any of the modelled scenarios. Furthermore, the results are FSA calculations impacting revenues, impairments and balance sheet items and assume an unchanged balance sheet from the end of 2009. The test confirms RBS remains well capitalised with a strong Tier 1 capital ratio under... -
Page 128
... Risk Management, in respect of risk-weighted assets (RWAs), manage and control the Group's balance sheet risks and consequent impact on the Group's capital, funding, liquidity, interest rate and currency risks. The FSA uses risk asset ratio (RAR) as a measure of capital adequacy in the UK banking... -
Page 129
... first loss Total Tier 2 capital Tier 3 Supervisory deductions Unconsolidated investments - RBS Insurance - other investments Other deductions Deductions from total capital Total regulatory capital Note: (1) Includes reduction for own liabilities carried at fair value 2010 £m 2009 £m 2008 £m 70... -
Page 130
... holdings Less APS first loss Total Tier 2 capital Tier 3 Supervisory deductions Unconsolidated investments - RBS Insurance - other investments Other deductions Deductions from total capital Total regulatory capital Note: (1) Includes reduction for own liabilities carried at fair value 70,388 1,719... -
Page 131
... are set out below: Credit risk £bn Counterparty risk £bn Market risk £bn Operational risk £bn Total £bn APS £bn Total £bn 2010 UK Retail UK Corporate Wealth Global Transaction Services Ulster Bank US Retail & Commercial Retail & Commercial Global Banking & Markets Other Core Non-Core Group... -
Page 132
Business review continued Balance sheet management: Capital* continued Asset Protection Scheme The Group acceded to the Asset Protection Scheme ('APS' or 'the Scheme') in December 2009. Following the accession to the APS, HM Treasury provides loss protection against potential losses arising in a ... -
Page 133
... the taxpayer. Implementation by the Group RBS is advanced in its planning to implement these new measures and is appropriately well-capitalised with tangible equity of £56 billion, Core Tier 1 capital of £49 billion and a Core Tier 1 ratio of 10.7% at 31 December 2010. RBS Group 2010 131 -
Page 134
... and shared intent to work together to help the UK economy recover and grow. The banks: x x x x expected loss net of provisions; deferred tax assets not relating to timing differences; unrealised losses on available-for-sale securities; and significant investments in non-consolidated financial... -
Page 135
Business review Risk and balance sheet management Structure of prudential regulation in the UK Following the consultation by HM Treasury on 'A new approach to financial regulation' in 2010, the government subsequently published further detailed proposals to give the Bank of England responsibility ... -
Page 136
...for each business and applied to the major operating subsidiary balance sheets. A variety of firm-specific and market related scenarios are used at the consolidated level and in individual countries. These scenarios include assumptions about significant changes in key funding sources, credit ratings... -
Page 137
Business review Risk and balance sheet management Funding sources The table below shows the composition of the Group's primary funding sources, excluding repurchase agreements. 2010 £m 2009 £m 2008 £m % % % Deposits by banks - cash collateral - other Debt securities in issue - commercial ... -
Page 138
Business review continued Balance sheet management: Funding and liquidity risk continued The tables below show the Group's debt securities in issue and subordinated liabilities by maturity. Debt securities in issue £m Subordinated liabilities £m 2010 Total £m % Less than one year 1-5 years ... -
Page 139
Business review Risk and balance sheet management Long-term debt issuances The table below shows debt securities issued by the Group with an original maturity of one year or more. The Group also executes other long-term funding arrangements (predominately term repurchase agreements) not reflected ... -
Page 140
...liquidity portfolio at the end of 2009 reflects the build up of liquid assets ahead of the legal separation of RBS N.V. and ABN AMRO in April 2010. Following the separation, the liquid assets and associated short-term wholesale funding were managed down to business as usual levels. x The Group has... -
Page 141
... the Basel III guidance issued in December 2010. This measure seeks to show the proportion of structural term assets which are funded by stable funding including customer deposits, long-term wholesale funding, and equity. 2010 £bn ASF(1) £bn 2009 £bn ASF(1) £bn 2008 £bn ASF(1) £bn Weighting... -
Page 142
Business review continued Balance sheet management: Funding and liquidity risk continued Funding and liquidity metrics continued The table below shows the Group's loan to deposit ratio and customer funding gap. Loan to deposit ratio (1) Group Core % % Customer funding gap (1) Group £bn 2010 2009... -
Page 143
Business review Risk and balance sheet management 2009 0-3 months £m 3-12 months £m 1-3 years £m 3-5 years £m 5-10 years £m 10-20 years £m Assets by contractual maturity Cash and balances at central banks Loans and advances to banks Debt securities Settlement balances Other financial ... -
Page 144
Business review continued Balance sheet management: Funding and liquidity risk continued Assets and liabilities by contractual cashflow maturity continued 2008 0-3 months £m 3-12 months £m 1-3 years £m 3-5 years £m 5-10 years £m 10-20 years £m Assets by contractual maturity Cash and ... -
Page 145
... and balance sheet management Interest rate risk The banking book consists of interest bearing assets, liabilities and derivative instruments used to mitigate risks which are accounted for on an accrual basis, as well as non-interest bearing balance sheet items which are not subjected to fair value... -
Page 146
... to rising rates related to capital raised in December 2009. x Actions taken during the year increased the current base level of net interest income, while reducing the Group's overall asset sensitivity. The Group seeks to limit the sensitivity to its Core Tier 1 ratio to 20 basis points in a 10... -
Page 147
Business review Risk and balance sheet management Equity risk The Group holds equity positions in order to achieve strategic objectives, support venture capital transactions or in respect of customer restructuring arrangements. The Group is exposed to market risk on these banking book equity ... -
Page 148
...of Group-wide and divisional policies setting out the risk parameters within which business units may operate. Information on the Group's credit portfolios is reported to the Board via the divisional and Group level risk committees detailed in the Governance section on page 120. Product/asset class... -
Page 149
..., operational and franchise risk related losses. The framework for the Group's appetite for country risk is set by the Executive Risk Forum (ERF) in the form of limits by country risk grade, with sub-limits on medium-term exposure. Authority is delegated to the Group Country Risk Committee to manage... -
Page 150
... £2.4 billion related to commercial real estate and £2.1 billion to manufacturing. The incidence of the main types of arrangements is analysed below: % of loans (by value) Term extensions Debt forgiveness Debt for equity Interest rate concessions and payment moratoriums The total above... -
Page 151
Business review Risk and balance sheet management Credit risk mitigation* The Group employs a number of structures and techniques to mitigate credit risk. Netting of debtor and creditor balances will be undertaken in accordance with relevant regulatory and internal policies; exposure on over-the-... -
Page 152
... for internal management reporting across portfolios, including a Group level asset quality scale, as shown below. Internal reporting and oversight of risk assets is principally differentiated by credit grades. Customers are assigned credit grades, based on 2010 Non-Core £m x Non-Core exposure... -
Page 153
Business review Risk and balance sheet management AQ10 credit risk assets UK Retail UK Corporate Wealth Global Transaction Services Ulster Bank US Retail & Commercial Retail & Commercial Global Banking & Markets Core Non-Core 2010 AQ10 % of divisional £m credit risk assets 2009 AQ10 % of ... -
Page 154
... and for those which, under the country watch list process, have been identified as exhibiting signs of actual or potential stress. The country risk tables below show credit risk assets exceeding £1 billion by borrowers domiciled in countries with an external rating of A+ and below from Standard... -
Page 155
... of collateralised trading activity. Portugal: lending decreased slightly by £0.1 billion related to reductions in corporate activity. Non-Core represents 41% of the total exposure; the structure of the exposure was enhanced through a shift to short-term and collateralised products to support the... -
Page 156
... loan portfolio. Particular attention is given to industry sectors where the Group believes there is a high degree of risk or potential for volatility in the future. The table below analyses credit risk assets by industry sector and geography. Industry sector 2010 (1) UK £m Western Europe (excl. UK... -
Page 157
...Core bank exposure resides primarily in Corporate Banking and Global Banking & Markets and the portfolio is well diversified geographically. In aggregate, the exposure within and asset quality of the Core portfolio remained stable over the year. Global economic conditions and related trends in trade... -
Page 158
...division (1) Core UK Corporate Ulster Bank US Retail & Commercial Global Banking & Markets The commercial real estate lending portfolio totalled £87 billion at 31 December 2010, a 11% decrease over the prior year (2009 - £98 billion). The Non-Core portion of the portfolio totalled £46 billion (52... -
Page 159
... senior management approval. Current market conditions have resulted in some borrowers experiencing difficulty in finalising long-term finance arrangements. These borrowers are managed within the problem debt management process in "watch" or the GRG. Tighter risk appetite criteria for new business... -
Page 160
... US. The analysis below includes both Core and Non-Core balances. Personal credit risk assets (1) UK Retail - mortgages - cards, loans and overdrafts Ulster Bank - mortgages - other personal Citizens - mortgages - auto and cards - other (2) Other (3) 2010 £m 2009 £m 2008 £m 92,592 18,072 21,162... -
Page 161
Business review Risk and balance sheet management Retail credit assets: UK residential mortgages Key points x The UK mortgage portfolio totalled £92.6 billion at 31 December 2010, an increase of 8% from 31 December 2009, due to continued strong sales growth and lower redemption rates in historical... -
Page 162
... in the year. (3) The 2009 data have been revised to exclude the Kroger Personal Finance portfolio, which was sold in 2010. Key points x The UK personal lending portfolio, of which 98% is in Core businesses, comprises credit cards, unsecured loans and overdrafts and totalled £18.1 billion at 31... -
Page 163
Business review Risk and balance sheet management Ulster Bank Group (Core and Non-Core)* Ulster Bank Group accounts for 8% of the Group's total credit risk assets or 7% of the Group's Core credit risk assets. The Irish economy has experienced severe economic headwinds resulting in a substantial ... -
Page 164
Business review continued Risk management: Credit risk continued Ulster Bank Group (Core and Non-Core)* continued Risk elements in lending and impairments by sector Gross loans (1) £m REIL £m Provisions £m REIL as a % of gross loans % Provisions as a % of REIL % Provisions as a % of gross loans... -
Page 165
Business review Risk and balance sheet management 2009 Gross loans (1) £m REIL £m Provisions £m REIL as a % of gross loans % Provisions as a % of REIL % Provisions as a % of gross loans % Impairment charge £m Amounts written-off £m Ulster Bank Group Mortgages Personal unsecured ... -
Page 166
... during the year Note: (1) LTV averages calculated by transaction volume. 2010 % 2009 % 2008 % 35.9 13.5 13.5 37.1 71.2 75.9 40.7 15.2 15.5 28.6 62.5 72.8 47.1 17.1 18.2 17.6 54.3 71.1 Key points x The residential mortgage portfolio across Ulster Bank Group totalled £21.2 billion at 31... -
Page 167
Business review Risk and balance sheet management Commercial real estate The Commercial real estate lending portfolio for Ulster Bank Group totalled £18 billion at 31 December 2010 and decreased by 2% during the year. The Non-Core portion of the portfolio totalled £12.6 billion (70% of the ... -
Page 168
... credit quality gradings. Credit risk assets analysed on the preceding pages are reported internally to senior management, however they exclude certain exposures, primarily debt securities, and take account of legal agreements, including master netting arrangements that provide a right of legal set... -
Page 169
Business review Risk and balance sheet management Loans and advances 2009 Core £m Non-Core £m Total £m Securities £m Derivatives £m Other (1) £m Total £m Netting and offset (2) £m Total Central and local government Finance - banks - other (3) Residential mortgages Personal lending ... -
Page 170
Business review continued Risk management: Credit risk continued Balance sheet analysis: Industry and geography analysis continued Loans and advances to banks and customers by geography The table below analyses loans and advances gross of provisions by geography (location of office). 2010 £m 2009... -
Page 171
Business review Risk and balance sheet management The tables below and on pages 169 to 173 analyse financial assets by geography (location of office) and industry. Loans and advances 2010 Core £m Non-Core £m Total £m Securities £m Derivatives £m Other (1) £m Total £m Netting and offset (2) ... -
Page 172
Business review continued Risk management: Credit risk continued Balance sheet analysis: Industry and geography analysis continued Loans and advances 2010 Core £m Non-Core £m Total £m Securities £m Derivatives £m Other (1) £m Total £m Netting and offset (2) £m RoW Central and local ... -
Page 173
Business review Risk and balance sheet management Loans and advances 2009 Core £m Non-Core £m Total £m Securities £m Derivatives £m Other (1) £m Total £m Netting and offset (2) £m Europe Central and local government Finance - banks - other (3) Residential mortgages Personal lending ... -
Page 174
Business review continued Risk management: Credit risk continued Balance sheet analysis: Industry and geography analysis continued Netting and offset (2) £m 2008 Loans and advances £m Securities £m Derivatives £m Other (1) £m Total £m UK Central and local government Finance - banks - ... -
Page 175
Business review Risk and balance sheet management 2008 Loans and advances £m Securities £m Derivatives £m Other (1) £m Total £m Netting and offset (2) £m Europe Central and local government Finance - banks - other (3) Residential mortgages Personal lending Property Construction ... -
Page 176
... the customer type. All credit grades across the Group map to both a Group level asset quality scale, used for external financial reporting, and a master grading scale for wholesale exposures used for internal management reporting across portfolios. Debt securities are analysed by external ratings... -
Page 177
Business review Risk and balance sheet management 2010 Cash and balances at central banks £m Loans and advances to banks (1) £m Loans and advances to customers £m Settlement balances £m Derivatives £m Other financial instruments £m Commitments £m Contingent liabilities £m Total £m... -
Page 178
Business review continued Risk management: Credit risk continued Balance sheet analysis: Asset quality continued Cash and balances at central banks £m Loans and advances to banks (1) £m Loans and advances to customers £m Other financial instruments £m 2008 Settlement balances £m ... -
Page 179
... review Risk and balance sheet management Central and local government 2009 UK £m US £m Other £m Banks and building societies £m ABS (1) £m Corporate £m Other £m Total £m % of total (2) AAA AA to AA+ A to AABBB- to ANon-investment grade Unrated Group before RFS MI RFS MI Group 2008... -
Page 180
... and local government 2010 UK £m US £m Other £m Banks and building societies £m ABS £m Corporate £m Other £m Total £m Held-for-trading (HFT) Designated as at fair value through profit or loss Available-for-sale Loans and receivables Total Short positions (HFT) Net 2009 5,097 1 8,377... -
Page 181
... netting agreements in respect of mark-to-market (mtm) values and collateral do not result in a net presentation in the Group's balance sheet under IFRS. 2010 6-12 months £m 0-3 months £m 3-6 months £m 1-5 years £m Over 5 years £m Total £m 2009 Total £m AQ1 AQ2 AQ3 AQ4 AQ5 AQ6 AQ7... -
Page 182
... greater than 0.5% of the Group's total assets. None of these countries have experienced repayment difficulties that have required restructuring of outstanding debt. Government £m 2010 Banks £m Other £m Total £m 2009 Total £m 2008 Total £m United States France Germany Japan Spain... -
Page 183
Business review Risk and balance sheet management REIL, provisions and reserves All the disclosures in this section (pages 181 to 192) are audited. The Group classifies impaired assets as either risk elements in lending (REIL) or potential problem loans (PPL). REIL represents impaired loans, and ... -
Page 184
... Irish property prices. x x Past due analysis The table below shows loans and advances to customers that were past due at the balance sheet date but not considered impaired: 2009 Group before RFS MI £m 2010 Core £m Non-Core £m Total £m Core £m Non-Core £m RFS MI £m Group £m 2008 Group... -
Page 185
Business review Risk and balance sheet management Loans, REIL and impairments by industry and geography The tables below analyse gross loans and advances to customers and banks (excluding reverse repos and disposal groups), REIL, provisions, impairment charge and amounts written-off relating to ... -
Page 186
...loans % Impairment charge £m Amounts written-off £m 2009 REIL £m Provisions £m Central and local government Finance - banks - other Residential mortgages Personal lending Property Construction Manufacturing Service industries and business activities... 471 6,478 461 6,939 184 RBS Group 2010 -
Page 187
Business review Risk and balance sheet management 2010 Gross loans £m REIL £m Provisions £m Core REIL as a % of gross loans % Provisions as a % of REIL % Provisions as a % of gross loans % Impairment charge £m Amounts written-off £m Central and local government Finance - banks - other... -
Page 188
...government Finance - banks - other Residential mortgages Personal lending Property Construction Manufacturing Service industries and business activities Agriculture, forestry and fishing Finance leases and instalment credit Interest accruals Latent of which: UK Europe US RoW Group before RFS MI 2009... -
Page 189
Business review Risk and balance sheet management Risk elements in lending and potential problem loans by division The tables below analyse the Group's loans and advances to banks and customers (excluding reverse repos and disposal groups) and related REIL, PPL, provisions, impairments, amounts ... -
Page 190
.... Available-for-sale financial assets are initially recognised at fair value plus directly related transaction costs and are subsequently measured at fair value with changes in fair value reported in owners' equity until disposal, at which stage the cumulative gain or loss is recognised in profit or... -
Page 191
Business review Risk and balance sheet management Movement in loan impairment provisions The movement in provisions balance by division is shown in the table below. UK Retail £m UK Corporate £m Wealth £m GTS (1) £m Ulster Bank £m US R&C (2) £m Total R&C (2) £m GBM (3) £m Total Core £m Non-... -
Page 192
... following table analyses impairment losses. 2010 £m 2009 £m 2008 £m Latent loss Collectively assessed Individually assessed Loans to customers Loans to banks Securities Charge to income statement Charge relating to customer loans as a % of gross customer loans (1) Note: (1) Gross of provisions... -
Page 193
Business review Risk and balance sheet management Available-for-sale debt securities and related reserves The table below analyses available-for-sale (AFS) debt securities by issuer and related AFS reserves, for countries exceeding £0.5 billion at any reporting date below, together with the total ... -
Page 194
... available-for-sale debt securities that were in an unrealised loss position at 31 December, and the related gross unrealised losses. Less than 12 months Gross unrealised Fair value losses £m £m More than 12 months Gross unrealised Fair value losses £m £m Total Gross unrealised losses £m 2010... -
Page 195
... desk level market risk limits. A daily report summarises the Group's market risk exposures against agreed limits. This daily report is sent to the Head of Restructuring & Risk, Global Head of Market & Insurance Risk, business Chief Risk Officers and appropriate business Risk Managers. The head of... -
Page 196
... assets, money market business and the management of internal funds flow within the Group's businesses. Traded portfolios The primary focus of the Group's trading activities is to provide an extensive range of debt and equity financing, risk management and investment services to its customers... -
Page 197
... the VaR for the Group's trading portfolios segregated by type of market risk exposure. Trading VaR Interest rate Credit spread Currency Equity Commodity Diversification Average £m 2010 Period end £m Maximum £m Minimum £m Average £m 2009 Period end £m Maximum £m Minimum £m 51.6 166... -
Page 198
Business review continued Risk management: Market risk continued Traded portfolios continued Key points x The Group's period end VaR reduced as the exceptional volatility of the market data from the period of the financial crisis dropped out of the 500 days of time series data used in the VaR ... -
Page 199
... Core Non-Core 30.5 1.3 Key points x The non-traded credit spread, Core and total VaR have decreased significantly due to the implementation of the relative price-based mapping scheme in the VaR methodology discussed above and the sales of available-for-sale securities in the US mortgage business... -
Page 200
Business review continued Risk management: Market risk continued Structured Credit Portfolios Drawn notional 2010 CDOs £m CLOs £m MBS (1) £m Other ABS £m Total £m CDOs £m CLOs £m Fair value MBS (1) £m Other ABS £m Total £m 1-2 years 2-3 years 3-4 years 4-5 years 5-10 years >10 years - ... -
Page 201
... the Group's business as it is inherent in the processes it operates in to provide services to customers and generate profit for shareholders. An objective of operational risk management is not to remove operational risk altogether, but to manage the risk to an acceptable level, taking into account... -
Page 202
...report regularly on the internal control framework for which they are responsible, confirming its adequacy and effectiveness. This includes certifying compliance with the requirements of Group policies. x x x Each business unit must manage its operational risk exposure within an acceptable level... -
Page 203
Business review Risk and balance sheet management Operational risk metrics Reporting forms an integral part of operational risk management. The Group's risk management processes are designed to ensure that issues are identified, escalated and managed on a timely basis. Exposures for each division ... -
Page 204
... process, and planning for the introduction of new or changed rules and regulations. During the last 12 months the Group has experienced unprecedented levels of prospective rules and regulations particularly in the area of prudential regulation (capital, liquidity, governance and risk management... -
Page 205
...' liabilities. Pension scheme liabilities vary with changes to long-term interest rates, inflation, pensionable salaries and the longevity of scheme members as well as changes in legislation. The Group is exposed to the risk that the market value of the schemes' assets, together with future returns... -
Page 206
...-Core businesses. Definitions of acronyms used in this section can be found in the Glossary on pages 434 to 439. Asset-backed securities The Group structures, originates, distributes and trades debt in the form of loan, bond and derivative instruments in all major currencies and debt capital markets... -
Page 207
Business review Risk and balance sheet management Asset-backed securities by product, geography and measurement classification FVTPL (1) US £m UK £m Other Europe £m RoW (2) £m Total £m HFT (3) £m DFV (4) £m AFS (5) £m LAR (6) £m 2010 Gross exposure RMBS: G10 government RMBS: covered bond... -
Page 208
Business review continued Risk management: Other risk exposures continued Asset-backed securities by product, geography and measurement classification continued FVTPL (1) US £m UK £m Other Europe £m RoW (2) £m Total £m HFT (3) £m DFV (4) £m AFS (5) £m LAR (6) £m 2009 Gross exposure RMBS... -
Page 209
... RMBS: G10 government RMBS: covered bond RMBS: prime RMBS: non-conforming RMBS: sub-prime CMBS CDOs CLOs Other ABS Notes: (1) Fair value through profit or loss. (2) Rest of the world. (3) Held-for-trading. (4) Designated as at fair value. (5) Available-for-sale. (6) Loans and receivables. 33... -
Page 210
... Key points x Carrying values of asset-backed securities decreased by £16.8 billion during 2010 with net reductions across all portfolios. x x Within G10 government RMBS, net sell-downs by the US Mortgage Trading business in GBM in the first quarter of 2010, as part of the Group's repositioning... -
Page 211
... 2,174 Key point x Non-investment grade securities increased by £1.4 billion of which £1.0 billion was in CDOs reflecting purchases by GBM's Mortgage Trading business as well as credit down grades and rating withdrawals of certain ABS structures in Non-Core during the year. RBS Group 2010 209 -
Page 212
...and the credit enhancement of the securitisation structure. Several tranches of notes are issued, each secured against the same portfolio of mortgages, but providing differing levels of seniority to match the risk appetite of investors. The most junior (or equity) notes will suffer early capital and... -
Page 213
... Net (debit)/credit relating to reclassified debt securities Net credit/(debit) to income statement (1) Note: (1) Comprises the following elements for the year ended 2010 and 2009: - a loss of £5 million (2009 - £2,387 million) in income from trading activities; - impairment reversals/(losses) of... -
Page 214
Business review continued Risk management: Other risk exposures continued Monoline insurers continued A number of debt instruments with monoline protection were reclassified from HFT to AFS in 2008. Changes in the fair value since the reclassification are recognised in the income statement to the ... -
Page 215
... wrapped securities and other assets with credit enhancement from monoline insurers. These securities are traded with the benefit of this credit enhancement. Any deterioration in the credit rating of the monoline is reflected in the fair value of these assets. 2010 £m 2009 £m 2008 £m Gross... -
Page 216
Business review continued Risk management: Other risk exposures continued Credit derivative product companies continued The table below details CDPC exposures by rating. Notional: protected assets £m Fair value: reference protected assets £m Gross exposure £m Credit valuation adjustment £m Net... -
Page 217
...of its participation in the Asset Protection Scheme, due to the unique features of this derivative. The net income statement effect arising from the change in level of CVA for all other counterparties and related trades is shown in the table below. 2010 £m 2009 £m Credit valuation adjustment at... -
Page 218
... finance exposures during the year. Drawn £m 2010 Undrawn £m Total £m Drawn £m 2009 Undrawn £m Total £m Balance at 1 January Transfers (out)/in (from credit trading business) Sales and restructurings Repayments and facility reductions Funded deals Lapsed/collapsed deals Changes in fair value... -
Page 219
... set out below. 2010 £m 2009 £m 2008 £m UK Corporate - debt financing (1) - senior debt transactions (2) Total UK Corporate Ulster Bank 3,664 2,604 6,268 597 6,865 4,041 3,034 7,075 621 7,696 4,496 2,330 6,826 694 7,520 Notes: (1) Loans for UK mid-market buyouts, supplementing equity capital... -
Page 220
... own-asset conduit in 2009 with a committed liquidity of £26.0 billion (2009 - £25.1 billion) to access the Bank of England's open market operations for contingent funding purposes. x x x The average maturity of ABCP issued by the Group's conduits has risen throughout 2010, to 69.4 days (2009... -
Page 221
Business review Risk and balance sheet management Collateral analysis, profile, credit ratings and weighted average lives relating to the Group's consolidated conduits are detailed below. Funded assets 2010 Loans £m Securities £m Total £m Undrawn £m Liquidity for third parties £m Total ... -
Page 222
Business review continued Risk management: Other risk exposures continued Conduits continued CP funded assets Geographic distribution Other Europe US £m £m Credit ratings (S&P equivalent) RoW £m Total £m Weighted average life - years AAA £m AA £m A £m BBB £m Below BBB £m 2010 UK £m ... -
Page 223
Business review Risk and balance sheet management Asset Protection Scheme* All the disclosures in this section (pages 221 to 224) are unaudited and are marked with an asterisk (*). References to 'Group' in this section relate to 'Group before RFS MI'. Key aspects of the Scheme On 22 December 2009, ... -
Page 224
... finance portfolios (2010 - £6.7 billion). Credit impairments and write downs The table below analyses the cumulative credit impairment losses and adjustments to par value (including AFS reserves) relating to the covered assets. 2010 £m 2009 £m 2008 £m Loans and advances Debt securities... -
Page 225
... of structured finance and leveraged finance assets in 2010. (5) The Scheme rules contain provision for on-going revision of data. Key points x The Group received loss credits in relation to some of the withdrawals and disposals of £1.2 billion in 2010. x The Group currently expects recoveries... -
Page 226
Business review continued Risk management: Asset Protection Scheme* continued Risk-weighted assets The table below analyses by division, risk-weighted assets (RWAs) covered by APS. 2010 £bn 2009 £bn UK Retail UK Corporate Ulster Retail & Commercial Global Banking & Markets Core Non-Core APS ... -
Page 227
...226 Board of directors and secretary 228 Executive Committee 230 Report of the directors 235 Corporate governance 246 Letter from the Chair of the Remuneration Committee 248 Directors' remuneration report 264 Directors' interests in shares 265 Statement of directors' responsibilities RBS Group 2010... -
Page 228
... of UK Financial Investments Limited which manages the UK Government's shareholding in banks. He is currently a non-executive director of Anglo American plc. Executive directors Stephen Hester (age 50) Group Chief Executive Appointed to the Board on 1 October 2008 and to the position of Group Chief... -
Page 229
... of financial services and risk management, including previous responsibility for Aviva's continental European and international life and long-term savings businesses. He held a number of senior executive positions during his career at Aviva, including his role as Group Finance Director until... -
Page 230
Executive Committee The Executive Committee provides executive input to the Group Board, and monitors and reports to the Group Board on all operational and day to day activities in relation to the Group's businesses. It is responsible for managing Group wide issues and those operational issues ... -
Page 231
... the RBS Group as Chief Executive of Business Services, becoming the Group Chief Administrative Officer in February 2009. At the same time he was re-appointed to the Managing Board of ABN AMRO to oversee the integration programme. Ron started his career with ABN Bank in 1986 as an IT/Systems analyst... -
Page 232
... policies and information on the Group's exposure to price, credit, liquidity and cash flow risk, is discussed in the Risk and balance sheet management section of the Business review on pages 119 to 224. Financial performance A review of the Group's performance during the year ended 31 December 2010... -
Page 233
... RBS branches in England and Wales and NatWest branches in Scotland to Santander UK plc. The sale remains subject to regulatory and other approvals. The sale of 80.01% of the Global Merchant Services ("GMS") business to a consortium of Advent International and Bain Capital completed in November 2010... -
Page 234
... the UK banking sector; and clearly differentiate in their annual reports between information that is audited and information that is unaudited. The Group's 2010 financial statements have been prepared in compliance with the code's principles. Corporate governance The company is committed to high... -
Page 235
... issued by the company to directors, members of the Group's Executive and Management Committees and FSA Approved Persons. In terms of section 236 of the Companies Act, Qualifying Pension Scheme Indemnity Provisions have been issued to all trustees of the Group's pension schemes. Post balance sheet... -
Page 236
...words. Shareholders will be asked to renew this authorisation at the Annual General Meeting in 2011. During 2010, the Group made no political donations in the UK or EU. In keeping with the Group's employment policies, Coutts & Company allowed a member of staff paid leave during the year to stand for... -
Page 237
... company is committed to high standards of corporate governance, business integrity and professionalism in all its activities. Throughout the year ended 31 December 2010, the company has complied with all of the provisions of the Combined Code issued by the Financial Reporting Council in June 2008... -
Page 238
... of the Group's interim results, having served just over nine years on the Board. The names and biographical details of directors are shown on pages 226 and 227. Further information in relation to the company's Annual General Meeting can be found in the Chairman's letter to shareholders. Information... -
Page 239
... Group's processes for internal audit and external audit and reviews the practices of the Divisional Risk and Audit Committees. The Audit Committee report is set out on pages 240 to 243. Board Risk Committee The Board Risk Committee is comprised of at least three independent non-executive directors... -
Page 240
...Audit, Board Risk, Remuneration and Nominations Committees are available to answer questions at the Annual General Meeting. The Senior Independent Director is also available. Communication with the company's largest institutional shareholders is undertaken as part of the Investor Relations programme... -
Page 241
... in 2011. The effectiveness of the Group's internal control system is reviewed regularly by the Board, the Audit Committee and the Board Risk Committee. Executive management committees or boards of directors in each of the Group's businesses receive regular reports on significant risks facing their... -
Page 242
... and the Board Risk Committee undertook six visits in 2010. These were to the Global Banking & Markets business; the Non-Core Division, Global Restructuring Group and the Asset Protection Scheme; Major Change Projects ongoing in the Group; the US Asset-backed Securities business; Risk Management and... -
Page 243
...at fair value including the Group's credit market exposures and the disclosures provided; actuarial assumptions for the Group Pension Fund; impairment losses in the Group's portfolio of loans and advances and available-for-sale securities; impairment of goodwill and other purchased intangible assets... -
Page 244
... or other services related to the accounting records or financial statements; financial information systems design and implementation; appraisal or valuation services, fairness opinions or contribution-inkind reports; actuarial services; internal audit outsourcing services; management functions or... -
Page 245
... of the Committee, the external auditor, Divisional Chief Executive Officers and Finance Directors, Divisional Risk and Audit Committee and subsidiary audit committee Chairmen. The evaluation concluded that Group Internal Audit had operated effectively throughout 2010. Divisional Risk and Audit... -
Page 246
... Asset Protection Scheme; Major Change Projects ongoing in the Group; the US Assetbacked Securities business; Risk Management and the Global Banking & Markets, Global Transaction Services and Private Banking businesses in Asia. Work in 2010 During 2010, the work of the Board Risk Committee focused... -
Page 247
...Group Board regarding related authorities, limits and mandates. In February 2010, the Committee was presented with and approved the RBS Risk Management operational plan, considering the adequacy and effectiveness of resource and the scope and nature of the work undertaken by the function. RBS Group... -
Page 248
... and the need to show restraint. The Remuneration Committee and the Board have considered carefully their responsibilities and have applied judgement to achieve a balance whereby remuneration policy supports business goals without causing unacceptably high people risks. 246 RBS Group 2010 -
Page 249
... people who have continued to focus on service to our customers, managing risk and driving the performance of our core and non-core businesses. Our people are working hard to help return the Group to financial strength and the Remuneration Committee is committed to creating an environment in which... -
Page 250
... of remuneration policy, such as on risk and financial performance across the Group. In determining directors' remuneration, the Remuneration Committee has taken into account pay and employment conditions of employees of the company. It does this using an analysis of annual market data against... -
Page 251
... been reported to the Board and the actions are being progressed. Group-wide remuneration policy The Remuneration Committee has reviewed the Group's remuneration policy which is anticipated will apply in 2011 and in subsequent years. The remuneration policy supports the Group's business strategy and... -
Page 252
... Bank of Scotland Group Retirement Savings Plan. A little over one half of UK employees continue to participate in defined benefit pension arrangements. Executive remuneration policy Components of executive directors' remuneration Salary Base salaries of executive directors are reviewed annually... -
Page 253
...3.75 million shares for the Group Finance Director. These allocations were agreed, following consultation with shareholders at the beginning of 2011. The potential allocations represent normal maximum annual incentive levels for executive directors based on the share price prevailing at the start of... -
Page 254
...Sheet & Risk targets capture performance of Non-Core. Economic Profit, being a risk-adjusted financial measure, is consistent with the FSA Code, and also provides a balance between measuring growth and the cost of capital employed in delivering that growth. 200% 150% 100% 50% 252 RBS Group 2010 -
Page 255
...heart of the Strategic Plan x return attributable to shareholders is Core Operating Profit reported in the financial statements, excluding fair value of own debt and APS, taxed at a standard tax rate of 28%. equity is defined as tangible equity allocated to the Core businesses, with adjustments to... -
Page 256
Directors' remuneration report continued Risk underpin and clawback The Remuneration Committee will also review financial and operational performance against the Strategic Plan and risk performance prior to agreeing vesting of awards. If the Remuneration Committee considers that the vesting ... -
Page 257
... award (expected value) Group Finance Director - Bruce Van Saun 40 20 0 0 2005 FTSE 100 FTSE Banks RBS 2006 2007 2008 2009 2010 2005 2006 FTSE 100 2007 FTSE Banks 2008 2009 2010 Salary Benefits Pension allowance Benefits On-Target Bonus (deferred into shares) Salary Royal Bank of Scotland... -
Page 258
... from employment of the Group on 31 March 2010. Details of his pension are shown on page 262. Information regarding directors' service contracts is shown below: Date of current contract Notice period - from the company Notice period - from executive Executive directors Stephen Hester Bruce... -
Page 259
... 2008 1 April 2010 1 October 2008 1 November 2009 2011 2011 2011 2011 2011 2011 2011 2011 2011 Note: (1) Colin Buchan will stand down as a non-executive director of the Group on 5 August 2011 following the announcement of the Group's interim results, having served just over nine years on the Board... -
Page 260
...all Board and Board Committee work. (7) Retired with effect from 28 April 2010. No director received any expense allowances chargeable to UK income tax or compensation for loss of office/termination payment. The non-executive directors did not receive any bonus payments or benefits. 258 RBS Group... -
Page 261
...value, while factoring in the growing regulatory emphasis on risk-adjusted financial metrics. Awards granted in 2010 Market price on award £ Awards vested in 2010 Market price on vesting £ Awards held at 31 December 2010 End of period for qualifying conditions to be fulfilled Stephen Hester... -
Page 262
... options in 2009, the performance conditions for executive directors are based on a combination of relative and absolute Total Shareholder Return (TSR) measures. The market price of the company's ordinary shares at 31 December 2010 was 39.07p and the range during the year ended 31 December 2010 was... -
Page 263
...06.12 Notes: (1) Stephen Hester has voluntarily agreed to retain any shares that he receives for a further two years past the vesting date. (2) Awards held at 31 March 2010 when Gordon Pell ceased to be a director. This award was subject to performance conditions which were not achieved. (3) End of... -
Page 264
...remuneration report continued Directors' pension arrangements During 2010, Gordon Pell accrued pensionable service in The Royal Bank of Scotland Group Pension Fund (the RBS Fund) until his retirement date of 31 March 2010. The RBS Fund is a defined benefit fund registered with HM Revenue & Customs... -
Page 265
... enhanced its Directors' Remuneration Report to include the five highest paid senior executive officers as well as maintaining disclosure levels for executive directors. The data below relates to the five members of the Group's Executive Committee with the highest total remuneration for 2010. For... -
Page 266
... 46,891 19,535 195,350 Note: (1) Value is based on the share price at 31 December 2010, which was 39.07p. During the year ended 31 December 2010 the share price ranged from 31.25p to 58.05p. No other director had an interest in the company's ordinary shares during the year or held a non-beneficial... -
Page 267
...with International Financial Reporting Standards, give a true and fair view of the assets, liabilities, financial position and profit or loss of the company and the undertakings included in the consolidation taken as a whole; and the Business review, which is incorporated into the Directors' report... -
Page 268
...-interest income (excluding insurance premium income) Operating expenses Pension costs Auditors' remuneration Tax Profit attributable to preference shareholders and paid-in equity holders Ordinary dividends Profit dealt with in the accounts of the company Earnings per ordinary and B share Financial... -
Page 269
...comprehensive income, the statements of changes in equity and the cash flow statements for the year ended 31 December 2010, the related Notes 1 to 44 and the information identified as 'audited' in the Risk and balance sheet management section of the Business review. The financial reporting framework... -
Page 270
... rank pari-passu with ordinary shares. The accompanying notes on pages 287 to 385, the accounting policies on pages 275 to 286 and the audited sections of the Business review: Risk and balance sheet management on pages 119 to 224 form an integral part of these financial statements. 268 RBS Group... -
Page 271
... Financial statements Note 2010 £m 2009 £m 2008 £m Loss for the year Other comprehensive income/(loss) Available-for-sale financial assets Cash flow hedges Currency translation Actuarial gains/(losses) on defined benefit plans Other comprehensive income/(loss) before tax Tax (charge)/credit... -
Page 272
...Group Note 2010 £m 2009 £m 2008 £m 2010 £m Company 2009 £m 2008 £m Assets Cash and balances at central banks Loans and advances to banks Loans and advances to customers Debt securities subject to repurchase agreements Other debt securities Debt securities Equity shares Investments in Group... -
Page 273
... the year ended 31 December 2010 Financial statements Group 2010 £m 2009 £m 2008 £m 2010 £m Company 2009 £m 2008 £m Called-up share capital At 1 January Ordinary shares issued in respect of placing and open offers Ordinary shares issued in respect of rights issue Ordinary shares issued in... -
Page 274
... of changes in equity for the year ended 31 December 2010 continued Group 2010 £m 2009 £m 2008 £m 2010 £m Company 2009 £m 2008 £m Foreign exchange reserve At 1 January Retranslation of net assets Foreign currency (losses)/gains on hedges of net assets Tax Recycled to profit or loss on... -
Page 275
...(1,500) - 536 60 (10,197) (9,601) The accompanying notes on pages 287 to 385, the accounting policies on pages 275 to 286 and the audited sections of the Business review: Risk and balance sheet management on pages 119 to 224 form an integral part of these financial statements. RBS Group 2010 273 -
Page 276
... 3,496 1,573 5,069 35 36 39 The accompanying notes on pages 287 to 385, the accounting policies on pages 275 to 286 and the audited sections of the Business review: Risk and balance sheet management on pages to 119 to 224 form an integral part of these financial statements. 274 RBS Group 2010 -
Page 277
... using uniform accounting policies. 3. Revenue recognition Interest income on financial assets that are classified as loans and receivables, available-for-sale or held-to-maturity and interest expense on financial liabilities other than those at fair value through profit or loss are determined... -
Page 278
... for payment services are usually debited to the customer's account monthly or quarterly in arrears. Income is accrued at period end for services provided but not yet charged. Card related services - fees from credit card business include: 4. Assets held for sale and discontinued operations A non... -
Page 279
...Any gain or loss arising from a change in fair value is recognised in profit or loss. Rental income from investment property is recognised on a straight-line basis over the term of the lease. Lease incentives granted are recognised as an integral part of the total rental income. RBS Group 2010 277 -
Page 280
... in profit or loss except for differences arising on available-for-sale non-monetary financial assets, for example equity shares, which are included in the available-forsale reserve in equity unless the asset is the hedged item in a fair value hedge. The assets and liabilities of foreign operations... -
Page 281
... profit or loss included policyholders' assets underpinning insurance and investment contracts issued by the Group's life assurance businesses. Fair value designation significantly reduces the measurement inconsistency that would arise if these assets were classified as available-for-sale. Loans... -
Page 282
... foreign currency monetary available-for-sale financial assets are recognised in profit or loss together with interest calculated using the effective interest method (see Accounting policy 3). Other changes in the fair value of available-for-sale financial assets and any related tax are reported in... -
Page 283
... profit or loss include structured liabilities issued by the Group: designation significantly reduces the measurement inconsistency between these liabilities and the related derivatives carried at fair value; and in 2009 and 2008 investment contracts issued by the Group's life assurance businesses... -
Page 284
... obligation to return the securities to the stock lending counterparty is recorded. 22. Netting Financial assets and financial liabilities are offset and the net amount presented in the balance sheet when, and only when, the Group currently has a legally enforceable right to set off the recognised... -
Page 285
...using valuation techniques which take into account its exercise price, its term, the risk-free interest rate and the expected volatility of the market price of The Royal Bank of Scotland Group plc's shares. Vesting conditions are not taken into account when measuring fair value, but are reflected by... -
Page 286
... businesses. Debt securities in issue (held-for-trading and designated as at fair value though profit or loss) - principally comprise medium term notes. Short positions (held-for-trading) - arise in dealing and market making activities where debt securities and equity shares are sold which the Group... -
Page 287
... at a different time from accounting recognition. Deferred tax assets of £6,373 million were recognised as at 31 December 2010 (2009 - £7,039 million; 2008 £7,082 million). The Group has recognised deferred tax assets in respect of losses, principally in the UK, and short-term timing differences... -
Page 288
...' in December 2009. The interpretation clarifies that the profit or loss on extinguishing liabilities by issuing equity instruments should be measured by reference to fair value, preferably of the equity instruments. The interpretation, effective for the Group for annual periods beginning on... -
Page 289
... interest income Group 2010 £m 2009 £m 2008 £m Loans and advances to customers Loans and advances to banks Debt securities Interest receivable Customer accounts: demand deposits Customer accounts: savings deposits Customer accounts: other time deposits Deposits by banks Debt securities in issue... -
Page 290
... other financial assets and liabilities Changes in the fair value of investment properties Profit on sale of securities Profit on sale of property, plant and equipment (Loss)/profit on sale of subsidiaries and associates Life business profits/(losses) Dividend income Share of profits less losses of... -
Page 291
Financial statements 3 Operating expenses Group 2010 £m 2009 £m 2008 £m Wages, salaries and other staff costs Bonus tax Social security costs Share-based compensation Pension costs - defined benefit schemes (see Note 4) - curtailment gains (see Note 4) - defined contribution schemes Staff costs... -
Page 292
... follows: Group 2010 2009 2008 UK Retail UK Corporate Wealth Global Transaction Services Ulster Bank US Retail & Commercial Global Banking & Markets RBS Insurance Central items Core Non-Core Business Services Integration RFS Holdings minority interest Total UK USA Europe Rest of the World Total 26... -
Page 293
... date based on historic volatility over a period of up to seven years; an expected option lives that equal the vesting period; no dividends on equity shares; and a risk-free interest rate determined from the UK gilt rates with terms matching the expected lives of the options. RBS Group 2010 291 -
Page 294
... a number of pension schemes in the UK and overseas, predominantly defined benefit schemes, whose assets are independent of the Group's finances. The principal defined benefit scheme is The Royal Bank of Scotland Retirement Fund (the "Main scheme") which accounts for 84% (2009 - 61%; 2008 - 56... -
Page 295
... below: 2010 Notional amounts £m Fair value Assets Liabilities £m £m Notional amounts £m 2009 Fair value Assets Liabilities £m £m Notional amounts £m 2008 Fair value Assets Liabilities £m £m Inflation rate swaps Interest rate swaps Total return swaps Currency swaps Equity futures Currency... -
Page 296
... gains and losses Contributions by employer Contributions by plan participants and other scheme members Benefits paid Expenses included in service cost At 1 January 2010 Currency translation and other adjustments Income statement Expected return Interest cost Current service cost Past service cost... -
Page 297
... income statement due to their size. Following the legal separation of ABN AMRO Bank N.V. on 1 April 2010, ABN AMRO's principal pension scheme in the Netherlands was transferred to the State of the Netherlands. At 31 December 2009, this scheme had fair value of plan assets of £8,118 million (2008... -
Page 298
...reviews of interim financial information and £2.0 million (2009 - £1.6 million) in respect of reports to the Group's regulators in the UK and overseas. (3) Includes fees of £0.5 million (2009 - £2.1 million) in respect of work performed by the auditors as reporting accountants on debt and equity... -
Page 299
... the closing deferred tax assets and liabilities have been recognised at an effective rate of 27%. The impact of this change on the tax charge for the year is set out in the table above. 7 Profit attributable to preference shareholders and paid-in equity holders Group 2010 £m 2009 £m 2008... -
Page 300
... Other net interest payable and operating expenses Write-down of investments in subsidiaries Operating loss before tax Tax (charge)/credit Loss for the year Loss attributable to: Preference shareholders Paid-in equity holders Ordinary and B shareholders 2010 £m 2009 £m 2008 £m 60 24 53 137 1,042... -
Page 301
... and B share have been calculated based on the following: Group 2010 £m 2009 £m 2008 £m Earnings Loss attributable to ordinary and B shareholders Loss from discontinued operations attributable to ordinary and B shareholders Gain on redemption of preference shares and paid-in equity Loss from... -
Page 302
... (3) Customer accounts - repos - other (4) Debt securities in issue (5,6) Settlement balances Short positions Derivatives Accruals, deferred income and other liabilities Retirement benefit liabilities Deferred tax Insurance liabilities Subordinated liabilities Liabilities of disposal groups Equity... -
Page 303
... (3) Customer accounts - repos - other (4) Debt securities in issue (5,6) Settlement balances Short positions Derivatives Accruals, deferred income and other liabilities Retirement benefit liabilities Deferred tax Insurance liabilities Subordinated liabilities Liabilities of disposal groups Equity... -
Page 304
... assets/ liabilities £m 2008 Hedging derivatives £m Availablefor-sale £m Finance leases £m Total £m Assets Cash and balances at central banks Loans and advances to banks - reverse repos - other (1) Loans and advances to customers - reverse repos - other (2) Debt securities Equity shares... -
Page 305
... in the consolidated income statement: Group 2010 £m 2009 £m 2008 £m Gains/(losses) on financial assets/liabilities designated as at fair value through profit or loss Gains/(losses) on disposal or settlement of loans and receivables 279 267 1,441 (573) (901) 4 Notes: (1) Includes items... -
Page 306
... income and other liabilities Subordinated liabilities Equity - - 231 - - 231 1,029 8,742 - - 8,048 17,819 1,034 1,034 - 1,029 8,742 231 1,034 8,048 19,084 59,224 78,308 2009 Assets Loans and advances to banks (1) Loans and advances to customers (2) Debt securities (2) Investments in Group... -
Page 307
... income and other assets - 975 - 975 193 27,031 42,196 3 489 42,688 193 - 27,031 27,031 42,196 1,168 3 489 70,887 Liabilities Deposits by banks (3) Customer accounts (4) Debt securities in issue Derivatives (4) Accruals, deferred income and other liabilities Subordinated liabilities Equity... -
Page 308
... financial markets during the second half of 2008 was regarded by management as rare circumstances in the context of paragraph 50B of IAS 39 as amended. The tables below show the carrying value, fair value and the effect on profit or loss of reclassifications undertaken by the Group in 2008 and 2009... -
Page 309
... Fair value £m £m Amount recognised in profit or loss Impairment Income losses £m £m Amount that would have been recognised had reclassification not occurred £m Reduction in profit or loss as result of reclassification £m Reclassified from HFT to LAR Loans - leveraged finance - corporate... -
Page 310
...% £m Gains/ 31 December 2009 (losses) up to the date of Carrying Fair value value reclassification £m £m £m After reclassification Impairment losses £m Income £m Reclassified from HFT to LAR Loans - leveraged finance 510 - corporate and other loans 1,230 1,740 Debt securities - RMBS - CMBS... -
Page 311
...as result of reclassification not occurred reclassification £m £m 2007 Gains/(losses) recognised in the income statement in prior period £m After reclassification Impairment losses £m Income £m Reclassified from HFT to LAR Loans - leveraged finance - corporate and other loans Debt securities... -
Page 312
..., the Group Chief Accountant, Global Head of Market and Insurance Risk, GBM Chief Financial Officer and Non-Core Chief Financial Officer, and representation from front office trading and finance. Valuation issues, adjustments and reserves are reported to the GBM, Non-Core and Group Audit Committees... -
Page 313
... equity index prices - quoted prices are generally readily available for equity shares listed on the world's major stock exchanges and for major indices on such shares. Commodity prices - many commodities are actively traded in spot and forward contracts and futures on exchanges in London, New York... -
Page 314
..., as well as debit valuation adjustments to liabilities issued by the Group. CVA is discussed in Risk and balance sheet management - Other risk exposures - Credit valuation adjustments (pages 211 to 215). Bid-offer and liquidity reserves Fair value positions are adjusted to bid (for assets) or... -
Page 315
... not equate to the reported profit or loss for own credit. The balance sheet reserves are stated by conversion of underlying currency balances at spot rates for each period whereas the income statement includes intra-period foreign exchange sell-offs. The effect of change in credit spreads could be... -
Page 316
... Loans and advances to customers Reverse repos Collateral Other Debt securities Government MBS CDOs CLOs Other ABS Corporate Banks and building societies Other Equity shares Derivatives Foreign exchange Interest rate Credit - APS Credit - other Equities and commodities Total assets Of which: Core... -
Page 317
...bn 2009 Level 2 Level 3 £bn £bn Total £bn Level 1 £bn 2008 Level 2 Level 3 £bn £bn Total £bn Liabilities Deposits by banks Repos Collateral Other Customer accounts Repos Collateral Other Debt securities in issue Short positions Derivatives Foreign exchange Interest rate Credit Equities... -
Page 318
... £m £m Balance £bn Balance £bn Assumptions Assets Loans and advances Debt securities MBS CDOs CLOs Other ABS Corporate Bank and building societies Equity shares Derivatives Foreign exchange Interest rate Credit - APS Credit - other Equities and commodities Total assets Total assets - 2008 Of... -
Page 319
... risk, correlation, volatility (70) Correlation, dividends (230) (270) (490) Total liabilities - 2008 Notes: (1) Level 1: valued using unadjusted quoted prices in active markets, for identical financial instruments. Examples include G10 government securities, listed equity shares, certain exchange... -
Page 320
... carried at fair value are classified as level 2: inputs are observable either directly (i.e. as a price) or indirectly (i.e. derived from prices). Active and inactive markets A key input in the decision making process for the allocation of assets to a particular level is liquidity. In general, the... -
Page 321
... rate, loan to value ratios, debt service coverage ratios, prepayment rates, cumulative loan loss information, yields, investor demand, market volatility since the last securitisation, and credit enhancement. Where observable market prices for a particular loan are not available, the fair value... -
Page 322
...level 3. Other asset-backed and corporate debt securities Where observable market prices for a particular debt security are not available, the fair value will typically be determined with reference to observable market transactions in other related products, such as similar debt securities or credit... -
Page 323
...both changes in market conditions and the profile of the portfolio of covered assets. As the inputs into the valuation model are not all observable the APS derivative is a level 3 asset. The fair value of the credit protection at 31 December 2010 was £0.55 billion (2009 - £1.40 billion). The Group... -
Page 324
... other financial instruments which are held at fair value determined from data which are not market observable, or incorporating material adjustments to market observed data. These include subordinated liabilities and write downs relating to undrawn syndicated loan facilities. 322 RBS Group 2010 -
Page 325
... £m Income statement £m Transfers in/(out) of Level 3 £m Foreign exchange £m At 31 December 2010 £m Gains/ (losses) relating to instruments held at year end £m 2010 SOCI £m Issuances £m Purchases £m Settlements £m Sales £m Assets FVTPL (1) Loans and advances Debt securities Equity... -
Page 326
... the market rate applicable at the balance sheet date for a similar portfolio with similar maturity and credit risk characteristics. Debt securities Fair values are determined using quoted prices where available or by reference to quoted prices of similar instruments. Deposits by banks and customer... -
Page 327
... 2008 More than 12 months £m Total £m Assets Cash and balances at central banks Loans and advances to banks Loans and advances to customers Debt securities Equity shares Settlement balances Derivatives Liabilities Deposits by banks Customer accounts Debt securities in issue Settlement balances... -
Page 328
... the balance sheet date, including future payments of interest. 2010 0-3 months £m 3-12 months £m Group 1-3 years £m 3-5 years £m 5-10 years £m 10-20 years £m Deposits by banks Customer accounts Debt securities in issue Derivatives held for hedging Subordinated liabilities Settlement balances... -
Page 329
... 3-12 months £m Company 1-3 years £m 3-5 years £m 5-10 years £m 10-20 years £m Customer accounts Debt securities in issue Subordinated liabilities 1,029 589 317 1,935 - 1,089 310 1,399 - 6,436 1,357 7,793 - 128 1,873 2,001 - 1,248 1,998 3,246 - - 3,482 3,482 2009 Deposits by banks... -
Page 330
... relating to loans and advances to banks (2009 - £157 million; 2008 - £127 million). (2) There is no provision for impairment losses in the company. Group Impairment losses charged to the income statement Loans and advances to customers Loans and advances to banks Debt securities Equity shares... -
Page 331
... corporate fixed-rate loans, fixed rate finance leases, fixed rate medium-term notes or preference shares classified as debt. At 31 December 2010, fixed rate financial assets of £48.8 billion and fixed rate financial liabilities of £63.9 billion were hedged by interest rate swaps in fair value... -
Page 332
... and fair values of the Group's derivatives. Group 2009 Liabilities £m Notional amount £bn Assets £m Liabilities £m Notional amount £bn 2010 Notional amount £bn Assets £m 2008 Assets £m Liabilities £m Exchange rate contracts Spot, forwards and futures Currency swaps Options purchased... -
Page 333
...361 Included above are derivatives held for hedging purposes as follows: 2010 Assets £m 2009 Assets £m 2008 Assets £m Fair value hedging Exchange rate contracts Interest rate contracts Liabilities £m Liabilities £m Liabilities £m - 252 - - - 239 - 14 - 193 225 - RBS Group 2010 331 -
Page 334
...Debt securities Group UK central and local government £m US central and local government £m Other central and local government £m Banks and building societies £m Asset backed securities (1) £m 2010 Corporate £m Other (2) £m Total £m Held-for-trading Designated as at fair value Available... -
Page 335
... asset-backed securities, issued by US federal agencies and government sponsored entities. 17 Equity shares Listed £m 2010 Unlisted £m Total £m Listed £m Group 2009 Unlisted £m Total £m Listed £m 2008 Unlisted £m Total £m Held-for-trading Designated as at fair value through profit or loss... -
Page 336
... accounting reference date of 31 December. Nature of business Country of incorporation and principal area of operation Group interest The Royal Bank of Scotland plc National Westminster Bank Plc (1) Citizens Financial Group, Inc. Coutts & Company (2) RBS Securities Inc. RBS Insurance Group Limited... -
Page 337
Financial statements 19 Intangible assets Core deposit intangibles £m Group Other purchased intangibles £m Internally generated software £m 2010 Goodwill £m Total £m Cost At 1 January 2010 Currency translation and other adjustments Additions Disposal of subsidiaries Disposals and write-off... -
Page 338
... on the accounts continued 19 Intangible assets continued Core deposit intangibles £m Group Other purchased intangibles £m Internally generated software £m 2008 Goodwill £m Total £m Cost At 1 January 2008 Transfers to disposal groups Currency translation and other adjustments Acquisition... -
Page 339
...CGUs at 30 September 2010 were based on the value in use test, using management's latest five-year forecasts. The long-term growth rates have been based on respective country GDP rates adjusted for inflation. The risk discount rates are based on observable market long-term government bond yields and... -
Page 340
... Additions Expenditure on investment properties Change in fair value of investment properties Disposals and write-off of fully depreciated assets At 31 December 2009 Accumulated impairment, depreciation and amortisation At 1 January 2009 Transfers to disposal groups Currency translation and other... -
Page 341
...Investment properties are valued to reflect fair value, that is, the market value of the Group's interest at the reporting date excluding any special terms or circumstances relating to the use or financing of the property and transaction costs that would be incurred in making a sale. Observed market... -
Page 342
... results of the State of the Netherlands and Santander in RFS Holdings B.V., following the legal separation of ABN AMRO Bank N.V. on 1 April 2010. Consortium partners' results are classified as discontinued operations and prior years have been represented accordingly. Discontinued operations in 2008... -
Page 343
...(c) Assets and liabilities of disposal groups Sempra £m Other £m 2010 £m 2009 £m 2008 £m Assets of disposal groups Cash and balances at central banks Loans and advances to banks Loans and advances to customers Debt securities and equity shares Derivatives Intangible assets Settlement balances... -
Page 344
... Group 2010 £m 2009 £m 2008 £m Debt securities - Government - Other issuers Equity shares 34,506 6,510 2,102 43,118 26,647 10,871 2,945 40,463 32,519 6,374 3,643 42,536 Note: (1) All short positions are classified as held-for-trading. 24 Accruals, deferred income and other liabilities Group... -
Page 345
...-sale financial assets £m Intangibles £m Cash flow hedging £m Share schemes £m Tax losses carried forward £m Other £m Total £m At 1 January 2009 Transfers to disposal groups (Disposal)/ acquisition of subsidiaries Charge/(credit) to income statement (Credit)/charge to equity directly... -
Page 346
Notes on the accounts continued 26 Insurance business Group 2010 £m 2009 £m 2008 £m Insurance premium income Reinsurers' share Net premium income Insurance claims Reinsurers' share Net claims 5,379 (251) 5,128 4,932 (149) 4,783 5,529 (263) 5,266 4,492 (135) 4,357 Group 6,009 (300) 5,709 4,... -
Page 347
... New business contribution (1) Operating assumption changes Investment return variances Economic assumption changes Transfer to shareholders' funds Disposal of subsidiaries Other Closing net assets Note: (1) New business contribution represents the present value of future profits on new insurance... -
Page 348
...) (113) - Group Assets backing linked liabilities Debt securities Equity securities Cash and cash equivalents The associated liabilities are: - linked contracts and participating bonds classified as insurance contracts - linked contracts classified as investment contracts 2010 £m 2009 £m 2008... -
Page 349
... liabilities as they fall due. The Group's focus is on high volume and relatively straightforward products, for example home and motor. This facilitates the generation of comprehensive underwriting and claims data, which are used to accurately price and monitor the risks accepted. RBS Group 2010... -
Page 350
... from the negligence of the insured (liability insurance). Business interruption losses come from the loss of income, revenue and/or profit as a result of property damage claims. Liability insurance includes employers' liability and public/products' liability. Liability insurance is written on an... -
Page 351
... these exchanges and on the redemption of securities classified as liabilities for cash, totalling £553 million were credited to profit or loss. No amounts have been recognised in profit or loss in relation to the redemption of securities classified as equity in the Group financial statements. The... -
Page 352
... 4,675 12,991 16,880 3,106 37,652 2009 2010 £m 2014-2018 £m Thereafter £m Perpetual £m Total £m 2008 - final redemption Sterling US dollars Euro Other £m 192 1,308 1,865 29 3,394 15 342 1,378 - 1,735 176 1,123 1,991 7 3,297 Group 2011-2013 £m 1,458 7,435 7,923 2,284 19,100 370... -
Page 353
...8,762 2009 2010 £m 2014-2018 £m Thereafter £m Perpetual £m Total £m 2008 - final redemption Sterling US dollars Euro £m 9 415 - 424 - - - - - 717 - 717 Company 2011-2013 £m - 1,381 - 1,381 400 2,863 1,668 4,931 200 2,661 - 2,861 609 8,037 1,668 10,314 Currently 2009 £m 2010... -
Page 354
... One Financial, Inc. US$400 million 6.375% subordinated notes 2012 RBS Holdings USA Inc. US$170 million subordinated loan capital floating rate notes 2009 US$100 million 5.575% senior subordinated revolving credit 2009 US$500 million subordinated loan capital floating rate notes 2010 (redeemed... -
Page 355
... are subordinated to the claims of other creditors. None of the Group's dated loan capital is secured. (5) Interest on all floating rate subordinated notes is calculated by reference to market rates. (6) Transferred to the Dutch State on legal separation of ABN AMRO Holding N.V. RBS Group 2010 353 -
Page 356
...undated floating rate primary capital notes (callable on any interest payment date) (1,2) US$762 million (2009 - US$762 million; 2008 - US$1,200 million) 7.648% perpetual regulatory tier one securities (callable September 2031) (1,3,4) The Royal Bank of Scotland plc £31 million (2009 - £96 million... -
Page 357
... rate subordinated notes is calculated by reference to market rates. (10) Transferred to the Dutch State on legal separation of ABN AMRO Holding N.V. Preference shares 2010 £m 2009 £m 2008 £m The company (1) Non-cumulative preference shares of US$0.01 Series F US$156 million (2009 and 2008... -
Page 358
...be paid provided distributable profits are sufficient unless payment would breach the capital adequacy requirements of the UK Financial Services Authority. Distributions are not made if dividends are not paid on any series of the company's non-cumulative preference shares. The company classifies its... -
Page 359
...of tax Equity raised Equity withdrawn Transfer to retained earnings At 1 January 2010 Currency translation and other adjustments (Loss)/profit attributable to non-controlling interests - continuing operations - discontinued operations Dividends paid Losses on available-for-sale financial assets, net... -
Page 360
... grant the directors the power to issue a nominal amount of £1,610 million B shares of 1p each and £44,250 million ordinary shares of 25p each in connection with the company's participation in the UK Government's Asset Protection Scheme. (2) One dividend access share in issue. 358 RBS Group 2010 -
Page 361
... on 22 December 2009. Net proceeds were £25.1 billion. HM Treasury also agreed to subscribe for up to 16 billion further B shares with a nominal value of 1p each at 50p per share subject to certain conditions including the Group's Core Tier 1 capital ratio falling below 5%. The fair value of the... -
Page 362
... are discretionary are classified as equity. The conversion rights attaching to the convertible preference shares may result in the Group delivering a variable number of equity shares to preference shareholders; these convertible preference shares are treated as debt. 360 RBS Group 2010 -
Page 363
... which were transferred from merger reserve to retained earnings. Under the arrangements for accession to APS in December 2009, the company issued B shares in exchange for shares in Aonach Mor Limited. No share premium was recorded in the company financial statements through the operation of the... -
Page 364
... Group 2010 £m 2009 £m 2008 £m Nature of operating lease assets on the balance sheet Transportation Cars and light commercial vehicles Other 6,162 1,016 208 7,386 6,039 1,352 403 7,794 5,883 1,199 617 7,699 Amounts recognised as income and expense Finance leases - contingent rental income... -
Page 365
... 493 78 6,464 The Group provides asset finance to its customers through acting as a lessor. It purchases plant, equipment and intellectual property, renting them to customers under lease arrangements that, depending on their terms, qualify as either operating or finance leases. RBS Group 2010 363 -
Page 366
... liabilities Loans and advances to banks Loans and advances to customers Debt securities 2010 £m 2009 £m 2008 £m 27,271 46,352 7,200 80,823 25,712 38,924 8,723 73,359 43,126 53,894 13,191 110,211 Liabilities secured by Group assets Deposits by banks Customer accounts Debt securities in issue... -
Page 367
... APS first loss Total Tier 2 capital Tier 3 Supervisory deductions Unconsolidated investments - RBS Insurance - other investments Other deductions Deductions from total capital Total regulatory capital *Includes reduction for own liabilities carried at fair value It is the Group's policy to maintain... -
Page 368
... of credit providing for payment by the Group to a named beneficiary against presentation of specified documents, forward asset purchases, forward deposits placed and undrawn note issuance and revolving underwriting facilities, and other short-term trade related transactions. 366 RBS Group 2010 -
Page 369
...the Group's financial statements. The Group earned fee income of £629 million (2009 - £1,355 million; 2008 - £1,442 million) from these activities. The Financial Services Compensation Scheme The Financial Services Compensation Scheme (FSCS), the UK's statutory fund of last resort for customers of... -
Page 370
...effect on RBS Group's consolidated net assets, operating results or cash flows in any particular period. Shareholder litigation RBS Group and a number of its subsidiaries and certain individual officers and directors have been named as defendants in a class action filed in the United States District... -
Page 371
... RBS Group companies have been named as defendants in a number of purported class actions and other lawsuits in the United States that relate to the securitisation and securities underwriting businesses. In general, the cases involve the issuance of mortgage backed securities, collateralised debt... -
Page 372
... on selling PPI at point of sale of the credit product. On 14 October 2010, the CC published its final decision on remedies following the remittal which confirmed the point of sale prohibition. The CC intends to make the final order in the first quarter of 2011, with the key measures coming... -
Page 373
... for the market to work in the best interests of bank customers. The OFT stated that it would discuss these issues intensively with banks, consumer groups and other organisations, with the aim of reporting on progress by the end of March 2010. On 16 March 2010, the OFT announced that it had secured... -
Page 374
... banks, including an RBS Group subsidiary, seeking information related to residential mortgage lending practices and sales and securitisation of residential mortgage loans. This investigation is ongoing and RBS Group is co-operating. Previously, in 2008, the New York State Attorney General issued... -
Page 375
... review of the acquisition of ABN AMRO in 2007 and the 2008 capital raisings and an investigation into conduct, systems and controls within the Global Banking & Markets division of RBS Group. RBS Group and its subsidiaries co-operated fully with this review and investigation. On 2 December 2010... -
Page 376
... assets (Decrease)/increase in deposits by banks and customers Increase/(decrease) in insurance liabilities (Decrease)/increase in debt securities in issue Increase/(decrease) in other liabilities Increase/(decrease) in derivative liabilities Increase/(decrease) in settlement balances and short... -
Page 377
... assets Acquisitions and disposals Group 2010 £m 2009 £m 2008 £m Fair value given for businesses acquired Non-cash consideration Net outflow of cash in respect of purchases Other assets sold Non-cash consideration (Loss)/profit on disposal Net inflow of cash in respect of disposals Dividends... -
Page 378
Notes on the accounts continued 38 Analysis of changes in financing during the year Group Share capital, share premium, paid-in equity and merger reserve 2010 2009 2008 £m £m £m Company Share capital, share premium, paid-in equity and merger reserve 2010 2009 2008 £m £m £m Subordinated ... -
Page 379
... and equity financing, risk management and investment services to its customers. The division is organised along six principal business lines: money markets; rates flow trading; currencies and commodities; equities; credit and mortgage markets and portfolio management and origination. RBS Insurance... -
Page 380
... losses £m Operating profit/(loss) £m UK Retail UK Corporate Wealth Global Transaction Services Ulster Bank US Retail & Commercial Global Banking & Markets RBS Insurance Central items Core Non-Core Reconciling items RFS Holdings minority interest Fair value of own debt Amortisation of purchased... -
Page 381
... Global Banking & Markets RBS Insurance Central items Core Non-Core Reconciling items RFS Holdings minority interest Fair value of own debt Gain on redemption of own debt Strategic disposals Asset Protection Scheme credit default swap - fair value changes External £m 2010 Inter segment £m Total... -
Page 382
... Services Ulster Bank US Retail & Commercial Global Banking & Markets RBS Insurance Central items Core Non-Core Reconciling items RFS Holdings minority interest Fair value of own debt Gain on redemption of own debt Strategic disposals Asset Protection Scheme credit default swap - fair value changes... -
Page 383
...: UK Retail £m UK Corporate £m Global Transaction Services £m Ulster Bank £m US Retail & Commercial £m Global Banking & Markets £m RBS Insurance £m RFS Holdings minority interest £m Wealth £m Non-Core £m Total £m At 1 January 2008 Transfers to disposal groups Currency translation... -
Page 384
...of location of office where the transactions are recorded. Group UK £m USA £m Europe £m Rest of the World £m Total £m 2010 Total revenue Net interest income Net fees and commissions Income from trading activities Other operating income/(loss) Insurance premium income (net of reinsurers' share... -
Page 385
... no reportable transactions or balances with the company. 43 Related parties UK Government On 1 December 2008, the UK Government through HM Treasury became the ultimate controlling party of The Royal Bank of Scotland Group plc. The UK Government's shareholding is managed by UK Financial Investments... -
Page 386
... December 2010, 2009 and 2008. Notes: (1) In addition to UK Government's shareholding in the Group, the UK Government and UK Government controlled bodies may hold debt securities, subordinated liabilities and other liabilities or shares issued by the Group in the normal course of their business. It... -
Page 387
...funding from the Bank of England and issued debt guaranteed by the Government totalling £41.5 billion (2009 - £51.5 billion; 2008 - £32.2 billion). Other related parties a) In their roles as providers of finance, Group companies provide development and other types of capital support to businesses... -
Page 388
Additional information 387 Financial summary 395 Exchange rates 396 Economic and monetary environment 397 Supervision 398 Regulatory developments and reviews 399 Description of property and equipment 399 Major shareholders 399 Material contracts 405 Risk factors 386 RBS Group 2010 -
Page 389
... consolidated balance sheet Loans and advances Debt securities and equity shares Derivatives and settlement balances Other assets Total assets Owners' equity Non-controlling interests Subordinated liabilities Deposits Derivatives, settlement balances and short positions Other liabilities Total... -
Page 390
..., gains on pensions curtailment, bonus tax, Asset Protection Scheme credit default swap - fair value changes and write-down of goodwill and other intangible assets expressed as a percentage of average ordinary and B shareholders' equity. (7) For this purpose, earnings consist of income before tax... -
Page 391
... customer. After 1 year but within 5 years £m Within 1 year £m After 5 years £m 2010 Total £m 2009 £m 2008 £m 2007 £m 2006 £m UK Central and local government Finance Residential mortgages Personal lending Property Construction Manufacturing Service industries and business activities... -
Page 392
...closing provisions against loans and advances to banks of £127 million (2009 - £157 million; 2008 - £127 million; 2007 - £3 million; 2006 - £2 million). (3) For the purpose of these ratios, closing customer provisions and customer charge exclude loans and advances to banks. 390 RBS Group 2010 -
Page 393
... The following table shows additional information in respect of loan impairment provisions. 2010 £m 2009 £m 2008 £m 2007 £m 2006 £m Loan impairment provisions at end of year Customers Banks 18,055 127 18,182 610,131 17,126 157 17,283 821,155 10,889 127 11,016 858,333 6,449 3 6,452... -
Page 394
... customer. 2010 £m 2009 £m 2008 £m 2007 £m 2006 £m Domestic Manufacturing Construction Finance Service industries and business activities Agriculture, forestry and fishing Property Residential mortgages Personal lending Finance leases and instalment credit Total domestic Foreign Total write... -
Page 395
... of loans that would be reported using the SEC's classifications. The figures are stated before deducting the value of security held or related provisions. 2010 £m 2009 £m 2008 £m 2007 £m 2006 £m Loans accounted for on an impaired basis (2) Domestic Foreign Total Accruing loans which... -
Page 396
...-bearing Time deposits - savings - other Total UK offices Overseas Demand deposits - interest-free - interest-bearing Time deposits - savings - other Total overseas offices Total deposits Held-for-trading Designated as at fair value through profit or loss Amortised cost Total deposits Overseas... -
Page 397
...year (1) Consolidation rate (2) Period end rate Average rate for the year Notes: (1) The average of the Noon Buying Rates on the last US business day of each month during the year. (2) The rates used by the Group for translating US dollars into sterling in the preparation of its financial statements... -
Page 398
... UK, the Group's largest market, economic conditions improved in 2010. Total economic activity, as measured by gross domestic product (GDP), grew by 1.3 per cent in 2010. This followed a contraction of 4.9 per cent in 2009. However, a fall in activity in the final quarter of 2010 served as a timely... -
Page 399
... Coutts & Co, Adam & Company Investment Management Limited, and in the Global Banking & Markets division, through RBS Asset Management Limited. General insurance business is principally undertaken by Direct Line Insurance plc and Churchill Insurance Company Limited. The Group is subject to extensive... -
Page 400
... of requirements impacting products and processes. Examples include the FSA's review of mortgages (Mortgage Market Review) and of investment advice (Retail Distribution Review). With regard to payment cards, the Group worked closely with the Government (the Department of Business Innovation and... -
Page 401
... in each country in which it operates so that internal policies are sufficient to ensure the effective management of regulatory risk. Description of property and equipment The Group operates from a number of locations worldwide, principally in the UK. At 31 December 2010, the Royal Bank and NatWest... -
Page 402
... the possible benefits under the APS; (vi) develop and, subject to market conditions, implement a liability management plan which is designed to enable the Group to meet certain Core Tier 1 capital targets for 2009; and (vii) use best endeavours (giving regard to reasonable operational requirements... -
Page 403
... the Contingent Subscription as a result of future legislative or regulatory changes; (iv) negotiating in good faith to maintain the status of the B shares and Dividend Access Share as Core Tier 1 capital; and (v) restrictions in relation to the company's share premium account. RBS Group 2010 401 -
Page 404
... Scheme Conditions is accounted for as a credit derivative and it tailors the APS to the company (by, amongst other things, setting applicable bank-specific thresholds and addressing a limited number of other bank-specific issues). Under the APS, HM Treasury is liable to make payments to the company... -
Page 405
... Limited agreed to sell 311 Royal Bank of Scotland branded branches in England and Wales, seven NatWest branded branches in Scotland, the retail and SME customer accounts attached to these branches, the Direct SME business, and certain mid-corporate businesses and associated assets and liabilities... -
Page 406
... Capital ('Bain') which has now changed its name to WorldPay (UK) Limited) entered into a Transfer Agreement pursuant to which the Royal Bank (either directly or through its group companies) sold 80.01 per cent of its Global Merchant Services business for an enterprise value of up to £2.025 billion... -
Page 407
... in the holding company group to be transferred and where such property is held on trust, removing or altering the terms of such trust. The taking of any such actions may adversely affect the rights of holders of the Securities, the price or value of their investment in the Securities and/or the... -
Page 408
..., may cause the Group to incur losses or to experience further reductions in business activity, increased funding costs and funding pressures, lower prices of the ordinary shares, decreased asset values, additional writedowns and impairment charges and lower profitability. 406 RBS Group 2010 -
Page 409
.... This, as well as credit rating downgrades experienced by such member states, could adversely affect the Group's access to the debt capital markets and may increase the Group's funding costs, which could have a material adverse impact on the Group's earnings, cash flow and financial condition. In... -
Page 410
... plan depends on the success of the Group's refocus on its core strengths and its balance sheet reduction programme. In light of the changed global economic outlook, the Group is engaged in a financial and core business restructuring which is focused on achieving appropriate risk-adjusted returns... -
Page 411
...Scheme closed for new transactions in January 2009. All of the Group's financing under the United Kingdom Government Credit Guarantee Scheme and the Special Liquidity Scheme matures in 2011 and 2012. As at 31 December 2010, the total amount outstanding of debt instruments issued by RBS which benefit... -
Page 412
... financial condition and its results of operations or result in a loss of value in the Securities. Further information about the write-downs which the Group has incurred and the assets it has reclassified can be found in the Risk and balance sheet management section of the Business review. The value... -
Page 413
... Citizens Financial Group, Inc. ("Citizens"), The Royal Bank of Scotland N.V. (which was renamed from "ABN AMRO Bank N.V." on 6 February 2010) ("RBS N.V.") and RBS Securities Inc.) and may affect income from foreign exchange dealing. The company prepares its consolidated financial statements in... -
Page 414
...to syndicate loans as a result of market conditions, a growth in unfunded pension exposures or otherwise) or to access funding sources, could have a material adverse impact on its financial condition and regulatory capital position or result in a loss of value in the securities. 412 RBS Group 2010 -
Page 415
...'s business, margins, profitability, financial condition and prospects or result in a loss of value in the Securities. As a condition to HM Treasury support, the company has agreed to certain undertakings which may serve to limit the Group's operations. Under the terms of the First Placing and Open... -
Page 416
... of the Group's businesses. In recent years, the Group has altered certain of the pension benefits it offers to staff and some employees continue to participate in defined benefit arrangements. The following two changes have been made to the main defined benefit pension plans: (i) a yearly limit on... -
Page 417
... impact on how the Group conducts its business, applicable authorisations and licences, the products and services it offers, its reputation, the value of its assets, its funding costs and its results of operations and financial condition or result in a loss of value in its securities. Areas in which... -
Page 418
...results of operations or financial condition or result in a loss of value in the Securities. A funding valuation of the Group's major defined benefit pension plan, The Royal Bank of Scotland Group Pension Fund is currently being carried out with an effective date of 31 March 2010. Operational risks... -
Page 419
... schemes (such as in the United States with the Federal Deposit Insurance Corporation), the Group may make further provisions and may incur additional costs and liabilities, which may have an adverse impact on its financial condition and results of operations or result in a loss of value... -
Page 420
... the Group's business, capital position, financial condition and results of operations. On 22 December 2009, the Group acceded to the APS with HM Treasury acting on behalf of the United Kingdom Government. Under the APS, the Group purchased credit protection over a portfolio of specified assets and... -
Page 421
... requisite levels. If RBSG is unable to issue the Contingent B Shares, the Group's business, results of operations, financial condition and capital position and ratios will suffer, its credit ratings may drop, its ability to lend and access funding will be further limited and its cost of funding may... -
Page 422
... of the Banking Act, and investors may receive no value for their Securities. The extensive governance, asset management and information requirements under the Scheme Conditions and any changes or modifications to the Scheme Conditions may have a negative impact on the expected benefits of the... -
Page 423
... the Scheme Conditions to continue to pay the annual fee to HM Treasury until 31 December 2099, which could have an adverse impact on the Group's results of operation or result in a loss of value in the Securities. Under certain circumstances, the Group cannot be assured that assets of RBS Holdings... -
Page 424
... of the removal of such Covered Assets will impact the level of protection available to the Group and may materially reduce the protection anticipated by the Group for its stressed losses, in which case its business, results of operations and financial condition will suffer. 422 RBS Group 2010 -
Page 425
... shareholders 426 Trading market 429 Dividend history 430 Taxation for US Holders 433 Exchange controls 433 Memorandum and Articles of Association 433 Incorporation and registration 433 Code of conduct 434 Glossary of terms 440 Index 443 Important addresses 443 Principal offices RBS Group 2010... -
Page 426
...Braille or audio version of the Annual Review and Summary Financial Statement should contact the Registrar on +44 (0)870 702 0135. ShareGift The company is aware that shareholders who hold a small number of shares may be retaining these shares because dealing costs make it uneconomical to dispose of... -
Page 427
Shareholder information Analyses of ordinary shareholders At 31 December 2010 Shareholdings Number of shares - millions % Individuals Banks and nominee companies Investment trusts Insurance companies Other companies Pension trusts Other corporate bodies 214,556 17,045 163 187 1,442 40 103 233,536... -
Page 428
... and holders from time to time of ADSs issued thereunder. The ordinary shares of the company are listed and traded on the London Stock Exchange. All ordinary shares are deposited with the principal London office of The Bank of New York Mellon, as custodian for the depository. 426 RBS Group 2010 -
Page 429
Shareholder information The following table shows, for the periods indicated, the high and low sales prices for each of the outstanding ADSs representing non-cumulative dollar preference shares and PROs, as reported...00 By year 2010 2009 2008 2007 2006 High Low High Low High Low High Low High Low ... -
Page 430
... high and low sales prices for the company's ordinary shares on the London Stock Exchange, as derived from the Daily Official List of the UK Listing Authority. Prices for 2008, 2007 and 2006 were restated for the effect of the rights issue in June 2008 and the capitalisation issue in September 2008... -
Page 431
...Final (3) Total dividends on equity shares 2010 pence 2009 pence 2008 pence 2007 pence 2006 pence - - - - - - - - - 8.5 19.3 27.8 6.8 18.5 25.3 Notes: (1) Each American Depository Share represents 20 ordinary shares. As discussed under Trading market, the American Depository Shares were issued... -
Page 432
... distributions of ordinary shares or rights to receive such shares) will constitute foreign source dividend income for US federal income tax purposes to the extent paid out of the current or accumulated earnings and profits of the company, as determined for US federal income tax purposes. Because... -
Page 433
... United States and was not a national of the UK); (ii) is part of the business property of a UK permanent establishment of an enterprise; or (iii) pertains to a UK fixed base of an individual used for the performance of independent personal services. The Estate Tax Treaty generally provides a credit... -
Page 434
... times listed on a 'recognised stock exchange' within the meaning of section 1005 of the Income Tax Act 2007, such as the main market of the New York Stock Exchange. In all other cases, an amount must be withheld on account of UK income tax at the basic rate (currently 20%) subject to any direction... -
Page 435
... limited company on 25 March 1968 under the name National and Commercial Banking Group Limited, and changed its name to The Royal Bank of Scotland Group Limited on 3 September 1979. On 10 March 1982 it was re-registered under the Companies Acts 1948 to 1980 as a public company with limited liability... -
Page 436
... characteristics include limited documentation; high loan-to-value ratio; secured on non-owner occupied properties; and debt-to-income ratio above normal limits. Arrears are the aggregate of contractual payments due on a debt that have not been met by the borrower. A loan or other financial asset is... -
Page 437
... as liabilities. They include money-market deposits, securities sold under repurchase agreements, federal funds purchased and other short term deposits. Deposits received from customers are recorded as customer accounts. Derivative - a contract or agreement whose value changes with changes in... -
Page 438
.... It buys mortgages, principally issued by banks, on the secondary market, pools them, and sells them as residential mortgage-backed securities to investors on the open market. Its obligations are not explicitly guaranteed by the full faith and credit of the US Government. Federal Home Loan Mortgage... -
Page 439
... historical loss experience (adjusted for current economic and credit conditions) and the period between an impairment occurring and a loan being identified and reported as impaired. Leveraged loans - funding (leveraged finance) provided to a business resulting in an overall level of debt that... -
Page 440
... from credit card receivables to residential mortgage loans). Liability securitisations typically involve issuing bonds that assume the risk of a potential insurance liability (ranging from a catastrophic natural event to an unexpected claims level on a certain product type). 438 RBS Group 2010 -
Page 441
... limited-purpose operating company that undertakes arbitrage activities by purchasing highly rated medium and long-term, fixed-income assets and funding itself with shortterm, highly rated commercial paper and medium-term notes. Structured notes - are securities that pay a return linked to the value... -
Page 442
... Corporate governance Compliance with the Combined Code Risk management The Board and its committees Credit market exposures Debt securities in issue Business review Consolidated Parent company Deposits Customer accounts Deposits from banks Derivatives 280 300 63 Description of business Directors... -
Page 443
... Five year financial summary Forward-looking statements Global Banking & Markets Global Transaction Services Glossary of terms Going concern Report of the directors Goodwill Accounting policy Notes on the accounts Group Chief Executive's review Impairment Accounting policy Business review Critical... -
Page 444
... information Notes on the accounts Shareholder information Analysis of shareholders Annual General Meeting Shareholder enquiries Short-term borrowings Statement of changes in equity Consolidated Parent company Statement of comprehensive income Consolidated Parent company Statement of directors... -
Page 445
...Royal Bank of Scotland Group plc PO Box 1000 Gogarburn Edinburgh EH12 1HQ Telephone: +44 (0)131 556 8555 Facsimile: +44 (0)131 626 3081 Investor Relations 280 Bishopsgate London EC2M 4RB Telephone: +44 (0)207 672 1758 Facsimile: +44 (0)207 672 1801 Email: [email protected] Registered office...