RBS 2010 Annual Report Download - page 182
Download and view the complete annual report
Please find page 182 of the 2010 RBS annual report below. You can navigate through the pages in the report by either clicking on the pages listed below, or by using the keyword search tool below to find specific information within the annual report.-
 1
1 -
2
-
3
-
4
-
5
-
6
-
7
-
8
-
9
-
10
-
11
-
12
-
13
-
14
-
15
-
16
-
17
-
18
-
19
-
20
-
21
-
22
-
23
-
24
-
25
-
26
-
27
-
28
-
29
-
30
-
31
-
32
-
33
-
34
-
35
-
36
-
37
-
38
-
39
-
40
-
41
-
42
-
43
-
44
-
45
-
46
-
47
-
48
-
49
-
50
-
51
-
52
-
53
-
54
-
55
-
56
-
57
-
58
-
59
-
60
-
61
-
62
-
63
-
64
-
65
-
66
-
67
-
68
-
69
-
70
-
71
-
72
-
73
-
74
-
75
-
76
-
77
-
78
-
79
-
80
-
81
-
82
-
83
-
84
-
85
-
86
-
87
-
88
-
89
-
90
-
91
-
92
-
93
-
94
-
95
-
96
-
97
-
98
-
99
-
100
-
101
-
102
-
103
-
104
-
105
-
106
-
107
-
108
-
109
-
110
-
111
-
112
-
113
-
114
-
115
-
116
-
117
-
118
-
119
-
120
-
121
-
122
-
123
-
124
-
125
-
126
-
127
-
128
-
129
-
130
-
131
-
132
-
133
-
134
-
135
-
136
-
137
-
138
-
139
-
140
-
141
-
142
-
143
-
144
-
145
-
146
-
147
-
148
-
149
-
150
-
151
-
152
-
153
-
154
-
155
-
156
-
157
-
158
-
159
-
160
-
161
-
162
-
163
-
164
-
165
-
166
-
167
-
168
-
169
-
170
-
171
-
 172
172 -
 173
173 -
 174
174 -
 175
175 -
 176
176 -
 177
177 -
 178
178 -
 179
179 -
 180
180 -
 181
181 -
 182
182 -
 183
183 -
 184
184 -
 185
185 -
 186
186 -
 187
187 -
 188
188 -
 189
189 -
 190
190 -
 191
191 -
 192
192 -
193
-
194
-
195
-
196
-
197
-
198
-
199
-
200
-
201
-
202
-
203
-
204
-
205
-
206
-
207
-
208
-
209
-
210
-
211
-
212
-
213
-
214
-
215
-
216
-
217
-
218
-
219
-
220
-
221
-
222
-
223
-
224
-
225
-
226
-
227
-
228
-
229
-
230
-
231
-
232
-
233
-
234
-
235
-
236
-
237
-
238
-
239
-
240
-
241
-
242
-
243
-
244
-
245
-
246
-
247
-
248
-
249
-
250
-
251
-
252
-
253
-
254
-
255
-
256
-
257
-
258
-
259
-
260
-
261
-
262
-
263
-
264
-
265
-
266
-
267
-
268
-
269
-
270
-
271
-
272
-
273
-
274
-
275
-
276
-
277
-
278
-
279
-
280
-
281
-
282
-
283
-
284
-
285
-
286
-
287
-
288
-
289
-
290
-
291
-
292
-
293
-
294
-
295
-
296
-
297
-
298
-
299
-
300
-
301
-
302
-
303
-
304
-
305
-
306
-
307
-
308
-
309
-
310
-
311
-
312
-
313
-
314
-
315
-
316
-
317
-
318
-
319
-
320
-
321
-
322
-
323
-
324
-
325
-
326
-
327
-
328
-
329
-
330
-
331
-
332
-
333
-
334
-
335
-
336
-
337
-
338
-
339
-
340
-
341
-
342
-
343
-
344
-
345
-
346
-
347
-
348
-
349
-
350
-
351
-
352
-
353
-
354
-
355
-
356
-
357
-
358
-
359
-
360
-
361
-
362
-
363
-
364
-
365
-
366
-
367
-
368
-
369
-
370
-
371
-
372
-
373
-
374
-
375
-
376
-
377
-
378
-
379
-
380
-
381
-
382
-
383
-
384
-
385
-
386
-
387
-
388
-
389
-
390
-
391
-
392
-
393
-
394
-
395
-
396
-
397
-
398
-
399
-
400
-
401
-
402
-
403
-
404
-
405
-
406
-
407
-
408
-
409
-
410
-
411
-
412
-
413
-
414
-
415
-
416
-
417
-
418
-
419
-
420
-
421
-
422
-
423
-
424
-
425
-
426
-
427
-
428
-
429
-
430
-
431
-
432
-
433
-
434
-
435
-
436
-
437
-
438
-
439
-
440
-
441
-
442
-
443
-
444
-
445
 |
 |

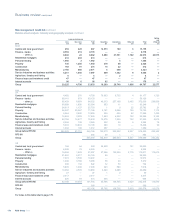
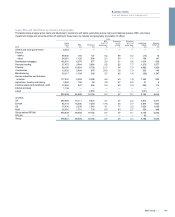
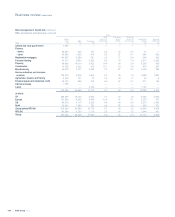
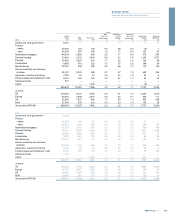
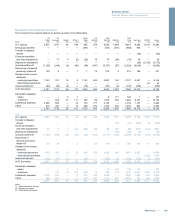
Risk management: Credit risk continued
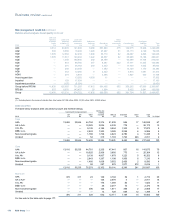
Balance sheet analysis: Derivatives continued
Contract type
0-3
months
£m
3-6
months
£m
6-12
months
£m
1-5
years
£m
Over 5
years
£m
Gross
assets
£m
Counterparty
mtm netting
£m
Net
exposure
£m
2008
Exchange rate 65,428 21,106 25,150 43,860 17,339 172,883 (113,451) 59,432
Interest rate 14,195 17,364 23,603 193,254 405,926 654,342 (597,482) 56,860
Credit derivatives 932 384 2,511 83,599 54,940 142,366 (112,119) 30,247
Equity and commodity 4,807 2,864 5,579 8,069 585 21,904 (10,645) 11,259
85,362 41,718 56,843 328,782 478,790 991,495 (833,697) 157,798
RFS MI 1,064 — 1,064
Group 992,559 (833,697) 158,862
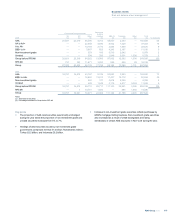
Key points
xWhilst gross exchange rate contracts increased due to the trading
fluctuations and favourable movements in forward rates and volume,
the mix in counterparty netting arrangements reduced the net
exposure.
xIn a year of significant quarterly interest rate volatility, the overall
annual interest rate trend was downwards, with all major rate indices
moving down by at least 30 basis points in the medium to long end,
with USD and GBP dropping approximately 70 basis points in the 5
year yield curve. The increase in gross asset values caused by the
drop in interest rates was offset by the greater use of London
Clearing House (LCH) as a counterparty, up from 56% at the end of
2009 to 60% by end of 2010. Reduction in non-LCH related netting
increased the net exposure, excluding the effect of collateral
arrangements. *
xThe reduction in credit derivatives primarily reflected the APS credit
derivative reducing from £1.4 billion at the start of the year to £550
million at end of 2010. The effect of credit spread widening in GBM
and Non-Core were offset by portfolio reductions, as part of de-
risking, and currency movements.
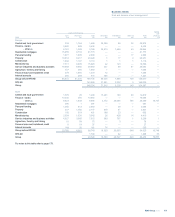
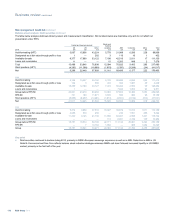
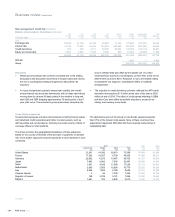
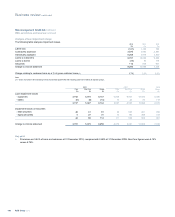
Cross border exposures
Cross border exposures are loans and advances including finance leases
and instalment credit receivables and other monetary assets, such as
debt securities and net derivatives, including non-local currency claims of
overseas offices on local residents.
The Group monitors the geographical breakdown of these exposures
based on the country of domicile of the borrower or guarantor of ultimate
risk. Cross border exposures exclude exposures to local residents in local
currencies.
The table below sets out the Group’s cross border exposures greater
than 0.5% of the Group’s total assets. None of these countries have
experienced repayment difficulties that have required restructuring of
outstanding debt.
2010
Government Banks Othe
r
Total 2009
Total
2008
Total
£m £m £m £m £m £m
United States 21,201 14,382 36,813 72,396
74,409 91,544
France 17,293 16,007 6,756 40,056
37,489 58,251
Germany 22,962 6,276 10,467 39,705
41,727 40,812
Japan 7,983 6,962 7,542 22,487
18,939 14,933
Spain 1,401 4,248 11,589 17,238
27,118 36,441
Netherlands 2,900 3,055 10,824 16,779
20,262 34,283
Italy 6,409 1,083 2,188 9,680
14,412 16,582
Cayman Islands 294 7,330 7,426
10,786 18,126
Republic of Ireland 199 3,789 3,101 7,089
14,902 18,662
Belgium 1,461 752 2,806 5,019
9,340 16,313
*unaudited
RBS Group 2010180
Business review continued