RBS 2010 Annual Report Download - page 396
Download and view the complete annual report
Please find page 396 of the 2010 RBS annual report below. You can navigate through the pages in the report by either clicking on the pages listed below, or by using the keyword search tool below to find specific information within the annual report.-
 1
1 -
2
-
3
-
4
-
5
-
6
-
7
-
8
-
9
-
10
-
11
-
12
-
13
-
14
-
15
-
16
-
17
-
18
-
19
-
20
-
21
-
22
-
23
-
24
-
25
-
26
-
27
-
28
-
29
-
30
-
31
-
32
-
33
-
34
-
35
-
36
-
37
-
38
-
39
-
40
-
41
-
42
-
43
-
44
-
45
-
46
-
47
-
48
-
49
-
50
-
51
-
52
-
53
-
54
-
55
-
56
-
57
-
58
-
59
-
60
-
61
-
62
-
63
-
64
-
65
-
66
-
67
-
68
-
69
-
70
-
71
-
72
-
73
-
74
-
75
-
76
-
77
-
78
-
79
-
80
-
81
-
82
-
83
-
84
-
85
-
86
-
87
-
88
-
89
-
90
-
91
-
92
-
93
-
94
-
95
-
96
-
97
-
98
-
99
-
100
-
101
-
102
-
103
-
104
-
105
-
106
-
107
-
108
-
109
-
110
-
111
-
112
-
113
-
114
-
115
-
116
-
117
-
118
-
119
-
120
-
121
-
122
-
123
-
124
-
125
-
126
-
127
-
128
-
129
-
130
-
131
-
132
-
133
-
134
-
135
-
136
-
137
-
138
-
139
-
140
-
141
-
142
-
143
-
144
-
145
-
146
-
147
-
148
-
149
-
150
-
151
-
152
-
153
-
154
-
155
-
156
-
157
-
158
-
159
-
160
-
161
-
162
-
163
-
164
-
165
-
166
-
167
-
168
-
169
-
170
-
171
-
172
-
173
-
174
-
175
-
176
-
177
-
178
-
179
-
180
-
181
-
182
-
183
-
184
-
185
-
186
-
187
-
188
-
189
-
190
-
191
-
192
-
193
-
194
-
195
-
196
-
197
-
198
-
199
-
200
-
201
-
202
-
203
-
204
-
205
-
206
-
207
-
208
-
209
-
210
-
211
-
212
-
213
-
214
-
215
-
216
-
217
-
218
-
219
-
220
-
221
-
222
-
223
-
224
-
225
-
226
-
227
-
228
-
229
-
230
-
231
-
232
-
233
-
234
-
235
-
236
-
237
-
238
-
239
-
240
-
241
-
242
-
243
-
244
-
245
-
246
-
247
-
248
-
249
-
250
-
251
-
252
-
253
-
254
-
255
-
256
-
257
-
258
-
259
-
260
-
261
-
262
-
263
-
264
-
265
-
266
-
267
-
268
-
269
-
270
-
271
-
272
-
273
-
274
-
275
-
276
-
277
-
278
-
279
-
280
-
281
-
282
-
283
-
284
-
285
-
286
-
287
-
288
-
289
-
290
-
291
-
292
-
293
-
294
-
295
-
296
-
297
-
298
-
299
-
300
-
301
-
302
-
303
-
304
-
305
-
306
-
307
-
308
-
309
-
310
-
311
-
312
-
313
-
314
-
315
-
316
-
317
-
318
-
319
-
320
-
321
-
322
-
323
-
324
-
325
-
326
-
327
-
328
-
329
-
330
-
331
-
332
-
333
-
334
-
335
-
336
-
337
-
338
-
339
-
340
-
341
-
342
-
343
-
344
-
345
-
346
-
347
-
348
-
349
-
350
-
351
-
352
-
353
-
354
-
355
-
356
-
357
-
358
-
359
-
360
-
361
-
362
-
363
-
364
-
365
-
366
-
367
-
368
-
369
-
370
-
371
-
372
-
373
-
374
-
375
-
376
-
377
-
378
-
379
-
380
-
381
-
382
-
383
-
384
-
385
-
 386
386 -
 387
387 -
 388
388 -
 389
389 -
 390
390 -
 391
391 -
 392
392 -
 393
393 -
 394
394 -
 395
395 -
 396
396 -
 397
397 -
 398
398 -
 399
399 -
 400
400 -
 401
401 -
 402
402 -
 403
403 -
 404
404 -
 405
405 -
 406
406 -
407
-
408
-
409
-
410
-
411
-
412
-
413
-
414
-
415
-
416
-
417
-
418
-
419
-
420
-
421
-
422
-
423
-
424
-
425
-
426
-
427
-
428
-
429
-
430
-
431
-
432
-
433
-
434
-
435
-
436
-
437
-
438
-
439
-
440
-
441
-
442
-
443
-
444
-
445
 |
 |

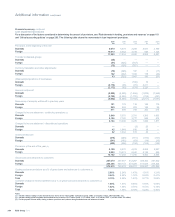
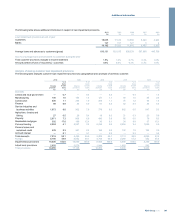
Financial summary continued
Analysis of deposits - product analysis
The following analyses the Group's deposits by type and geographical area.
2010
£m
2009
£m
2008
£m
UK
Domestic
Demand deposits
- interest-free 66,608 45,855 43,376
- interest-bearing 136,359 136,157 107,159
Time deposits
- savings 70,774 67,450 88,434
- other 59,557 65,937 130,951
Overseas residents
Demand deposits
- interest-free 2,512 1,072 907
- interest-bearing 12,530 13,618 16,320
Time deposits
- savings 1,512 1,288 1,819
- other 46,023 61,341 67,477
Total UK offices 395,875 392,718 456,443
Overseas
Demand deposits
- interest-free 29,919 36,458 29,253
- interest-bearing 43,890 91,482 92,354
Time deposits
- savings 24,472 78,423 68,014
- other 115,327 157,265 251,492
Total overseas offices 213,608 363,628 441,113
Total deposits 609,483 756,346 897,556
Held-for-trading 116,189 106,477 137,080
Designated as at fair value through profit or loss 4,824 8,580 8,054
Amortised cost 488,470 641,289 752,422
Total deposits 609,483 756,346 897,556
Overseas
US 135,642 126,075 153,163
Rest of the World 77,966 237,553 287,950
Total overseas offices 213,608 363,628 441,113
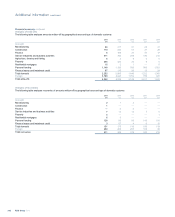
Certificates of deposit and other time deposits
The following table shows details of the Group's certificates of deposit and other time deposits over $100,000 or equivalent by remaining maturity.
2010
Within
3months
£m
Over 3
months
but within
6months
£m
Over 6
months
but within
12 months
£m
Over
12 months
£m
Total
£m
UK based companies and branches
Certificates of deposit 3,325 1,784 1,894 247 7,250
Other time deposits 23,180 4,282 2,872 11,462 41,796
Overseas based companies and branches
Certificates of deposit 14,120 7,423 4,192 377 26,112
Other time deposits 20,251 4,082 4,184 6,294 34,811
60,876 17,571 13,142 18,380 109,969
RBS Group 2010394
Additional information continued