RBS 2010 Annual Report Download - page 69
Download and view the complete annual report
Please find page 69 of the 2010 RBS annual report below. You can navigate through the pages in the report by either clicking on the pages listed below, or by using the keyword search tool below to find specific information within the annual report.-
 1
1 -
2
-
3
-
4
-
5
-
6
-
7
-
8
-
9
-
10
-
11
-
12
-
13
-
14
-
15
-
16
-
17
-
18
-
19
-
20
-
21
-
22
-
23
-
24
-
25
-
26
-
27
-
28
-
29
-
30
-
31
-
32
-
33
-
34
-
35
-
36
-
37
-
38
-
39
-
40
-
41
-
42
-
43
-
44
-
45
-
46
-
47
-
48
-
49
-
50
-
51
-
52
-
53
-
54
-
55
-
56
-
57
-
58
-
 59
59 -
 60
60 -
 61
61 -
 62
62 -
 63
63 -
 64
64 -
 65
65 -
 66
66 -
 67
67 -
 68
68 -
 69
69 -
 70
70 -
 71
71 -
 72
72 -
 73
73 -
 74
74 -
 75
75 -
 76
76 -
 77
77 -
 78
78 -
 79
79 -
80
-
81
-
82
-
83
-
84
-
85
-
86
-
87
-
88
-
89
-
90
-
91
-
92
-
93
-
94
-
95
-
96
-
97
-
98
-
99
-
100
-
101
-
102
-
103
-
104
-
105
-
106
-
107
-
108
-
109
-
110
-
111
-
112
-
113
-
114
-
115
-
116
-
117
-
118
-
119
-
120
-
121
-
122
-
123
-
124
-
125
-
126
-
127
-
128
-
129
-
130
-
131
-
132
-
133
-
134
-
135
-
136
-
137
-
138
-
139
-
140
-
141
-
142
-
143
-
144
-
145
-
146
-
147
-
148
-
149
-
150
-
151
-
152
-
153
-
154
-
155
-
156
-
157
-
158
-
159
-
160
-
161
-
162
-
163
-
164
-
165
-
166
-
167
-
168
-
169
-
170
-
171
-
172
-
173
-
174
-
175
-
176
-
177
-
178
-
179
-
180
-
181
-
182
-
183
-
184
-
185
-
186
-
187
-
188
-
189
-
190
-
191
-
192
-
193
-
194
-
195
-
196
-
197
-
198
-
199
-
200
-
201
-
202
-
203
-
204
-
205
-
206
-
207
-
208
-
209
-
210
-
211
-
212
-
213
-
214
-
215
-
216
-
217
-
218
-
219
-
220
-
221
-
222
-
223
-
224
-
225
-
226
-
227
-
228
-
229
-
230
-
231
-
232
-
233
-
234
-
235
-
236
-
237
-
238
-
239
-
240
-
241
-
242
-
243
-
244
-
245
-
246
-
247
-
248
-
249
-
250
-
251
-
252
-
253
-
254
-
255
-
256
-
257
-
258
-
259
-
260
-
261
-
262
-
263
-
264
-
265
-
266
-
267
-
268
-
269
-
270
-
271
-
272
-
273
-
274
-
275
-
276
-
277
-
278
-
279
-
280
-
281
-
282
-
283
-
284
-
285
-
286
-
287
-
288
-
289
-
290
-
291
-
292
-
293
-
294
-
295
-
296
-
297
-
298
-
299
-
300
-
301
-
302
-
303
-
304
-
305
-
306
-
307
-
308
-
309
-
310
-
311
-
312
-
313
-
314
-
315
-
316
-
317
-
318
-
319
-
320
-
321
-
322
-
323
-
324
-
325
-
326
-
327
-
328
-
329
-
330
-
331
-
332
-
333
-
334
-
335
-
336
-
337
-
338
-
339
-
340
-
341
-
342
-
343
-
344
-
345
-
346
-
347
-
348
-
349
-
350
-
351
-
352
-
353
-
354
-
355
-
356
-
357
-
358
-
359
-
360
-
361
-
362
-
363
-
364
-
365
-
366
-
367
-
368
-
369
-
370
-
371
-
372
-
373
-
374
-
375
-
376
-
377
-
378
-
379
-
380
-
381
-
382
-
383
-
384
-
385
-
386
-
387
-
388
-
389
-
390
-
391
-
392
-
393
-
394
-
395
-
396
-
397
-
398
-
399
-
400
-
401
-
402
-
403
-
404
-
405
-
406
-
407
-
408
-
409
-
410
-
411
-
412
-
413
-
414
-
415
-
416
-
417
-
418
-
419
-
420
-
421
-
422
-
423
-
424
-
425
-
426
-
427
-
428
-
429
-
430
-
431
-
432
-
433
-
434
-
435
-
436
-
437
-
438
-
439
-
440
-
441
-
442
-
443
-
444
-
445
 |
 |

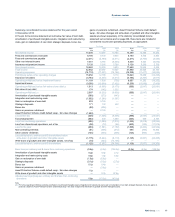
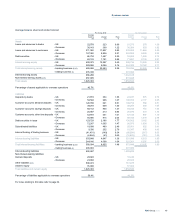
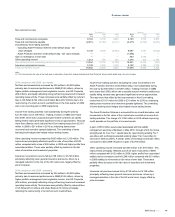
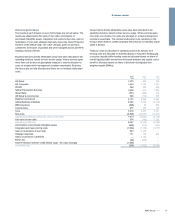
Analysis of change in net interest income - volume and rate analysis
Volume and rate variances have been calculated based on movements in average balances over the period and changes in interest rates on average
interest-earning assets and average interest-bearing liabilities. Changes due to a combination of volume and rate are allocated pro rata to volume and
rate movements.
2010 over 2009 - pro forma 2010 over 2009 - statutory
Increase/(decrease) due to changes in: Increase/(decrease) due to changes in:
Average
volume
Average
rate
Net
change
Average
volume
Average
rate
Net
change
£m £m £m £m £m £m
Interest-earning assets
Loans and advances to banks
UK 15 (70) (55) 15 (70) (55)
Overseas (4) (180) (184) (5) (180) (185)
Loans and advances to customers
UK (824) 867 43 (821) 864 43
Overseas (1,637) (920) (2,557) (1,679) (925) (2,604)
Debt securities
UK 311 (310) 1 312 (311) 1
Overseas (339) (606) (945) (253) (621) (874)
Total interest receivable of the banking business
UK (498) 487 (11) (494) 483 (11)
Overseas (1,980) (1,706) (3,686) (1,937) (1,726) (3,663)
(2,478) (1,219) (3,697) (2,431) (1,243) (3,674)
Interest-bearing liabilities
Deposits by banks
UK 74 267 341 74 268 342
Overseas 834 347 1,181 832 391 1,223
Customer accounts: demand deposits
UK (57) (5) (62) (57) (5) (62)
Overseas (10) (191) (201) (8) (188) (196)
Customer accounts: savings deposits
UK (194) 31 (163) (195) 32 (163)
Overseas 23 237 260 24 236 260
Customer accounts: other time deposits
UK 264 112 376 269 127 396
Overseas 319 385 704 379 426 805
Debt securities in issue
UK 146 830 976 147 829 976
Overseas 373 216 589 372 215 587
Subordinated liabilities
UK 150 222 372 187 185 372
Overseas 41 165 206 41 164 205
Internal funding of trading business
UK (83) (94) (177) (82) (95) (177)
Overseas (75) (75) (150) (76) (75) (151)
Total interest payable of the banking business
UK 300 1,363 1,663 343 1,341 1,684
Overseas 1,505 1,084 2,589 1,564 1,169 2,733
1,805 2,447 4,252 1,907 2,510 4,417
Movement in net interest income
UK (198) 1,850 1,652 (151) 1,824 1,673
Overseas (475) (622) (1,097) (373) (557) (930)
(673) 1,228 555 (524) 1,267 743
Note:
(1) The analysis into UK and Overseas has been compiled on the basis of location of office.
67RBS Group 2010
Business review