RBS 2010 Annual Report Download - page 354
Download and view the complete annual report
Please find page 354 of the 2010 RBS annual report below. You can navigate through the pages in the report by either clicking on the pages listed below, or by using the keyword search tool below to find specific information within the annual report.-
 1
1 -
2
-
3
-
4
-
5
-
6
-
7
-
8
-
9
-
10
-
11
-
12
-
13
-
14
-
15
-
16
-
17
-
18
-
19
-
20
-
21
-
22
-
23
-
24
-
25
-
26
-
27
-
28
-
29
-
30
-
31
-
32
-
33
-
34
-
35
-
36
-
37
-
38
-
39
-
40
-
41
-
42
-
43
-
44
-
45
-
46
-
47
-
48
-
49
-
50
-
51
-
52
-
53
-
54
-
55
-
56
-
57
-
58
-
59
-
60
-
61
-
62
-
63
-
64
-
65
-
66
-
67
-
68
-
69
-
70
-
71
-
72
-
73
-
74
-
75
-
76
-
77
-
78
-
79
-
80
-
81
-
82
-
83
-
84
-
85
-
86
-
87
-
88
-
89
-
90
-
91
-
92
-
93
-
94
-
95
-
96
-
97
-
98
-
99
-
100
-
101
-
102
-
103
-
104
-
105
-
106
-
107
-
108
-
109
-
110
-
111
-
112
-
113
-
114
-
115
-
116
-
117
-
118
-
119
-
120
-
121
-
122
-
123
-
124
-
125
-
126
-
127
-
128
-
129
-
130
-
131
-
132
-
133
-
134
-
135
-
136
-
137
-
138
-
139
-
140
-
141
-
142
-
143
-
144
-
145
-
146
-
147
-
148
-
149
-
150
-
151
-
152
-
153
-
154
-
155
-
156
-
157
-
158
-
159
-
160
-
161
-
162
-
163
-
164
-
165
-
166
-
167
-
168
-
169
-
170
-
171
-
172
-
173
-
174
-
175
-
176
-
177
-
178
-
179
-
180
-
181
-
182
-
183
-
184
-
185
-
186
-
187
-
188
-
189
-
190
-
191
-
192
-
193
-
194
-
195
-
196
-
197
-
198
-
199
-
200
-
201
-
202
-
203
-
204
-
205
-
206
-
207
-
208
-
209
-
210
-
211
-
212
-
213
-
214
-
215
-
216
-
217
-
218
-
219
-
220
-
221
-
222
-
223
-
224
-
225
-
226
-
227
-
228
-
229
-
230
-
231
-
232
-
233
-
234
-
235
-
236
-
237
-
238
-
239
-
240
-
241
-
242
-
243
-
244
-
245
-
246
-
247
-
248
-
249
-
250
-
251
-
252
-
253
-
254
-
255
-
256
-
257
-
258
-
259
-
260
-
261
-
262
-
263
-
264
-
265
-
266
-
267
-
268
-
269
-
270
-
271
-
272
-
273
-
274
-
275
-
276
-
277
-
278
-
279
-
280
-
281
-
282
-
283
-
284
-
285
-
286
-
287
-
288
-
289
-
290
-
291
-
292
-
293
-
294
-
295
-
296
-
297
-
298
-
299
-
300
-
301
-
302
-
303
-
304
-
305
-
306
-
307
-
308
-
309
-
310
-
311
-
312
-
313
-
314
-
315
-
316
-
317
-
318
-
319
-
320
-
321
-
322
-
323
-
324
-
325
-
326
-
327
-
328
-
329
-
330
-
331
-
332
-
333
-
334
-
335
-
336
-
337
-
338
-
339
-
340
-
341
-
342
-
343
-
 344
344 -
 345
345 -
 346
346 -
 347
347 -
 348
348 -
 349
349 -
 350
350 -
 351
351 -
 352
352 -
 353
353 -
 354
354 -
 355
355 -
 356
356 -
 357
357 -
 358
358 -
 359
359 -
 360
360 -
 361
361 -
 362
362 -
 363
363 -
 364
364 -
365
-
366
-
367
-
368
-
369
-
370
-
371
-
372
-
373
-
374
-
375
-
376
-
377
-
378
-
379
-
380
-
381
-
382
-
383
-
384
-
385
-
386
-
387
-
388
-
389
-
390
-
391
-
392
-
393
-
394
-
395
-
396
-
397
-
398
-
399
-
400
-
401
-
402
-
403
-
404
-
405
-
406
-
407
-
408
-
409
-
410
-
411
-
412
-
413
-
414
-
415
-
416
-
417
-
418
-
419
-
420
-
421
-
422
-
423
-
424
-
425
-
426
-
427
-
428
-
429
-
430
-
431
-
432
-
433
-
434
-
435
-
436
-
437
-
438
-
439
-
440
-
441
-
442
-
443
-
444
-
445
 |
 |

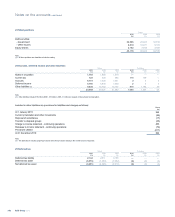
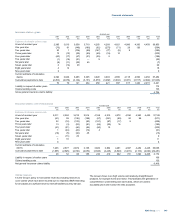
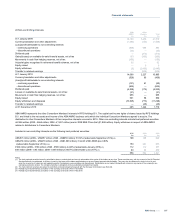
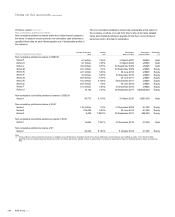
27 Subordinated liabilities continued
Dated loan capital
2010 2009 2008
£m £m £m
The company
US$400 million 6.4% subordinated notes 2009 —— 278
US$300 million 6.375% subordinated notes 2011 (redeemed February 2011) (1) 199 201 231
US$750 million 5% subordinated notes 2013 (1) 532 503 579
US$750 million 5% subordinated notes 2014 (1) 559 521 616
US$250 million 5% subordinated notes 2014 (1) 162 153 169
US$675 million 5.05% subordinated notes 2015 (1) 492 468 550
US$350 million 4.7% subordinated notes 2018 (1) 252 231 286
2,196* 2,077* 2,709*
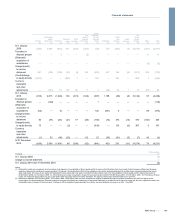
The Royal Bank of Scotland plc
€300 million 4.875% subordinated notes 2009 —— 298
€1,000 million 6% subordinated notes 2013 989 1,014 1,083
US$50 million floating rate subordinated notes 2013 38 36 36
€500 million 6% subordinated notes 2013 439 452 487
£150 million 10.5% subordinated bonds 2013 (2) 177 177 180
US$1,250 million floating rate subordinated notes 2014 —— 862
AUD590 million 6% subordinated notes 2014 (callable January 2011) 391 330 281
AUD410 million floating rate subordinated notes 2014 (callable January 2011) 272 229 195
CAD700 million 4.25% subordinated notes 2015 452 419 409
£250 million 9.625% subordinated bonds 2015 303 301 311
US$750 million floating rate subordinated notes 2015 (callable September 2011) 483 462 513
€750 million floating rate subordinated notes 2015 725 741 783
CHF400 million 2.375% subordinated notes 2015 287 244 257
CHF100 million 2.375% subordinated notes 2015 83 69 72
CHF200 million 2.375% subordinated notes 2015 136 117 125
US$500 million floating rate subordinated notes 2016 (callable October 2011) 322 308 346
US$1,500 million floating rate subordinated notes 2016 (callable April 2011) 967 926 1,038
€500 million 4.5% subordinated notes 2016 (callable January 2011) 450 476 511
CHF200 million 2.75% subordinated notes 2017 (callable December 2012) 138 120 129
€100 million floating rate subordinated notes 2017 86 89 97
€500 million floating rate subordinated notes 2017 (callable June 2012) 432 445 482
€750 million 4.35% subordinated notes 2017 (callable January 2017) 721 728 770
AUD450 million 6.5% subordinated notes 2017 (callable February 2012) 302 255 217
AUD450 million floating rate subordinated notes 2017 (callable February 2012) 295 250 214
US$1,500 million floating rate subordinated callable step-up notes 2017 (callable August 2012) 966 925 1,029
€2,000 million 6.93% subordinated notes 2018 1,999 2,017 2,136
US$125.6 million floating rate subordinated notes 2020 81 78 87
€1,000 million 4.625% subordinated notes 2021 (callable September 2016) 949 962 1,019
€300 million CMS linked floating rate subordinated notes 2022 280 292 303
€144.4 million floating rate subordinated notes 2022 153 143 152
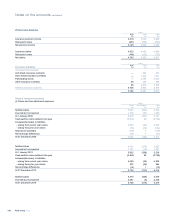
National Westminster Bank Plc
US$1,000 million 7.375% subordinated notes 2009 —— 697
€600 million 6% subordinated notes 2010 (redeemed January 2010) —564 623
€500 million 5.125% subordinated notes 2011 442 455 488
£300 million 7.875% subordinated notes 2015 370 365 379
£300 million 6.5% subordinated notes 2021 367 351 376
Charter One Financial, Inc.
US$400 million 6.375% subordinated notes 2012 265 255 287
RBS Holdings USA Inc.
US$170 million subordinated loan capital floating rate notes 2009 —— 116
US$100 million 5.575% senior subordinated revolving credit 2009 ——69
US$500 million subordinated loan capital floating rate notes 2010 (redeemed December 2010) —311 342
RBS Group 2010352
Notes on the accounts continued