RBS 2010 Annual Report Download - page 111
Download and view the complete annual report
Please find page 111 of the 2010 RBS annual report below. You can navigate through the pages in the report by either clicking on the pages listed below, or by using the keyword search tool below to find specific information within the annual report.-
 1
1 -
2
-
3
-
4
-
5
-
6
-
7
-
8
-
9
-
10
-
11
-
12
-
13
-
14
-
15
-
16
-
17
-
18
-
19
-
20
-
21
-
22
-
23
-
24
-
25
-
26
-
27
-
28
-
29
-
30
-
31
-
32
-
33
-
34
-
35
-
36
-
37
-
38
-
39
-
40
-
41
-
42
-
43
-
44
-
45
-
46
-
47
-
48
-
49
-
50
-
51
-
52
-
53
-
54
-
55
-
56
-
57
-
58
-
59
-
60
-
61
-
62
-
63
-
64
-
65
-
66
-
67
-
68
-
69
-
70
-
71
-
72
-
73
-
74
-
75
-
76
-
77
-
78
-
79
-
80
-
81
-
82
-
83
-
84
-
85
-
86
-
87
-
88
-
89
-
90
-
91
-
92
-
93
-
94
-
95
-
96
-
97
-
98
-
99
-
100
-
 101
101 -
 102
102 -
 103
103 -
 104
104 -
 105
105 -
 106
106 -
 107
107 -
 108
108 -
 109
109 -
 110
110 -
 111
111 -
 112
112 -
 113
113 -
 114
114 -
 115
115 -
 116
116 -
 117
117 -
 118
118 -
 119
119 -
 120
120 -
 121
121 -
122
-
123
-
124
-
125
-
126
-
127
-
128
-
129
-
130
-
131
-
132
-
133
-
134
-
135
-
136
-
137
-
138
-
139
-
140
-
141
-
142
-
143
-
144
-
145
-
146
-
147
-
148
-
149
-
150
-
151
-
152
-
153
-
154
-
155
-
156
-
157
-
158
-
159
-
160
-
161
-
162
-
163
-
164
-
165
-
166
-
167
-
168
-
169
-
170
-
171
-
172
-
173
-
174
-
175
-
176
-
177
-
178
-
179
-
180
-
181
-
182
-
183
-
184
-
185
-
186
-
187
-
188
-
189
-
190
-
191
-
192
-
193
-
194
-
195
-
196
-
197
-
198
-
199
-
200
-
201
-
202
-
203
-
204
-
205
-
206
-
207
-
208
-
209
-
210
-
211
-
212
-
213
-
214
-
215
-
216
-
217
-
218
-
219
-
220
-
221
-
222
-
223
-
224
-
225
-
226
-
227
-
228
-
229
-
230
-
231
-
232
-
233
-
234
-
235
-
236
-
237
-
238
-
239
-
240
-
241
-
242
-
243
-
244
-
245
-
246
-
247
-
248
-
249
-
250
-
251
-
252
-
253
-
254
-
255
-
256
-
257
-
258
-
259
-
260
-
261
-
262
-
263
-
264
-
265
-
266
-
267
-
268
-
269
-
270
-
271
-
272
-
273
-
274
-
275
-
276
-
277
-
278
-
279
-
280
-
281
-
282
-
283
-
284
-
285
-
286
-
287
-
288
-
289
-
290
-
291
-
292
-
293
-
294
-
295
-
296
-
297
-
298
-
299
-
300
-
301
-
302
-
303
-
304
-
305
-
306
-
307
-
308
-
309
-
310
-
311
-
312
-
313
-
314
-
315
-
316
-
317
-
318
-
319
-
320
-
321
-
322
-
323
-
324
-
325
-
326
-
327
-
328
-
329
-
330
-
331
-
332
-
333
-
334
-
335
-
336
-
337
-
338
-
339
-
340
-
341
-
342
-
343
-
344
-
345
-
346
-
347
-
348
-
349
-
350
-
351
-
352
-
353
-
354
-
355
-
356
-
357
-
358
-
359
-
360
-
361
-
362
-
363
-
364
-
365
-
366
-
367
-
368
-
369
-
370
-
371
-
372
-
373
-
374
-
375
-
376
-
377
-
378
-
379
-
380
-
381
-
382
-
383
-
384
-
385
-
386
-
387
-
388
-
389
-
390
-
391
-
392
-
393
-
394
-
395
-
396
-
397
-
398
-
399
-
400
-
401
-
402
-
403
-
404
-
405
-
406
-
407
-
408
-
409
-
410
-
411
-
412
-
413
-
414
-
415
-
416
-
417
-
418
-
419
-
420
-
421
-
422
-
423
-
424
-
425
-
426
-
427
-
428
-
429
-
430
-
431
-
432
-
433
-
434
-
435
-
436
-
437
-
438
-
439
-
440
-
441
-
442
-
443
-
444
-
445
 |
 |

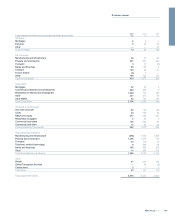
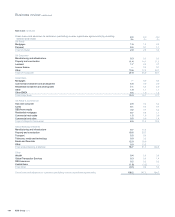
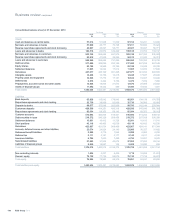
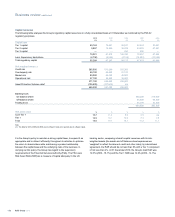
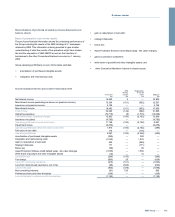
Commentary on consolidated balance sheet - pro forma
2009 compared with 2008
Total assets of £1,522.5 billion at 31 December 2009 were down £696.2
billion, 31%, compared with 31 December 2008, principally reflecting
substantial repayments of customer loans and advances, as corporate
customer demand fell and corporates looked to deleverage their balance
sheets. Lending to banks also fell in line with significantly reduced
wholesale funding activity. There were also significant falls in the value of
derivative assets, with a corresponding reduction in derivative liabilities.
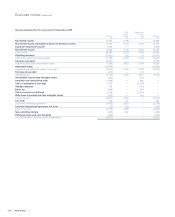
Cash and balances at central banks were up £39.7 billion to £51.5 billion
due to the placing of short-term cash surpluses, including the proceeds
from the issue of B shares in December, with central banks.
Loans and advances to banks decreased by £45.6 billion, 35%, to £83.9
billion with reverse repurchase agreements and stock borrowing ('reverse
repos') down by £23.7 billion, 40% to £35.1 billion and lower bank
placings, down £22.0 billion, 31%, to £48.8 billion, largely as a result of
reduced wholesale funding activity in Global Banking & Markets.
Loans and advances to customers were down £135.6 billion, 19%, at
£595.7 billion. Within this, reverse repos increased by 4%, £1.8 billion to
£41.0 billion. Excluding reverse repos, lending decreased by £137.3
billion to £554.7 billion or by £131.6 billion, 19%, before impairment
provisions. This reflected reductions in Global Banking & Markets of
£71.4 billion, and planned reductions in Non-Core of £30.1 billion,
including a £3.2 billion transfer to disposal groups in respect of RBS
Sempra Commodities JV and the Asian and Latin American businesses.
There were also reductions in US Retail & Commercial, £7.4 billion; UK
Corporate, £5.4 billion; Ulster Bank, £1.8 billion; and the effect of
exchange rate movements, £22.8 billion, following the strengthening of
sterling during the year, partially offset by growth in UK Retail of £9.2
billion, and in Wealth of £1.4 billion.
Debt securities decreased by £4.1 billion, 2%, to £249.1 billion and equity
shares decreased by £6.2 billion, 28%, to £16.0 billion, principally due to
the sale of the Bank of China investment and lower holdings in Global
Banking & Markets and Non-Core, largely offset by growth in Group
Treasury, in part reflecting an £18.0 billion increase in the gilt liquidity
portfolio.
Settlement balances were down £5.8 billion, 32%, at £12.0 billion as a
result of lower customer activity.
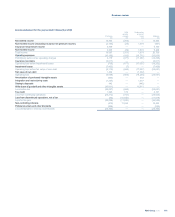
Movements in the value of derivative assets, down £553.3 billion, 56%, to
£438.2 billion, and liabilities, down £547.9 billion, 57%, to £421.5 billion,
reflect the easing of market volatility, the strengthening of sterling and
significant tightening in credit spreads in the continuing low interest rate
environment.
Increases in assets and liabilities of disposal groups reflect the inclusion
of the RBS Sempra Commodities JV business and the planned sale of a
number of the Group's retail and commercial activities in Asia and Latin
America.
Deposits by banks declined by £109.0 billion, 41%, to £153.6 billion, due
to a decrease in repurchase agreements and stock lending (‘repos’),
down £45.7 billion, 55%, to £38.0 billion and reduced inter- bank
deposits, down £63.3 billion, 35%, to £115.6 billion, principally in Global
Banking & Markets reflecting reduced reliance on wholesale funding.
Customer accounts were down £35.9 billion, 7%, to £482.6 billion. Within
this, repos increased £10.2 billion, 18%, to £68.4 billion. Excluding repos,
deposits were down £46.1 billion, 10%, to £414.3 billion, primarily due to
reductions in Global Banking & Markets, down £43.6 billion; Non-Core,
£13.0 billion, including the transfer of £8.9 billion to disposal groups; and
Ulster Bank, £1.2 billion; together with exchange rate movements, £11.3
billion, offset in part by growth across all other divisions, up £23.0 billion.
Debt securities in issue were down £23.1 billion, 9% to £246.3 billion,
mainly as a result of movements in exchange rates together with
reductions in Global Banking & Markets and Non-Core.
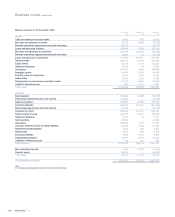
Retirement benefit liabilities increased by £1.2 billion, 74%, to £2.7 billion,
with net actuarial losses of £3.8 billion, arising from lower discount rates
and higher assumed inflation, partially offset by curtailment gains of £2.1
billion due to changes in prospective pension benefits.
Subordinated liabilities were down £12.1 billion, 28% to £31.5 billion,
reflecting the redemption of £5.0 billion undated loan capital, £1.5 billion
trust preferred securities and £2.7 billion dated loan capital, together with
the effect of exchange rate movements and other adjustments, £2.9
billion.
Equity non-controlling interests decreased by £3.2 billion, 59%, to £2.2
billion. Equity withdrawals of £3.1 billion, due to the disposal of the
investment in the Bank of China attributable to minority shareholders and
the redemption, in part, of certain trust preferred securities, the recycling
of related available-for-sale reserves to income, £0.4 billion, and
dividends paid of £0.3 billion, were partially offset by attributable profits of
£0.6 billion.
Owners' equity increased by £18.9 billion, 32% to £77.7 billion. The issue
of B shares to HM Treasury in December 2009 raised £25.1 billion, net of
expenses, and was offset in part by the creation of a £1.2 billion reserve
in respect of contingent capital B shares. The placing and open offer in
April 2009 raised £5.3 billion to fund the redemption of the £5.0 billion
preference shares issued to HM Treasury in December 2008. Actuarial
losses, net of tax, of £2.7 billion, the attributable loss for the period, £2.7
billion, exchange rate movements of £1.9 billion, the payment of other
owners' dividends of £0.9 billion including £0.3 billion to HM Treasury on
the redemption of preference shares, and partial redemption of paid-in
equity, £0.3 billion, were partly offset by increases in available-for-sale
reserves, £1.8 billion, cash flow hedging reserves, £0.6 billion, and the
equity owners gain on withdrawal of non-controlling interests, net of tax,
of £0.5 billion arising from the redemption of trust preferred securities.
109RBS Group 2010
Business review