RBS 2010 Annual Report Download - page 384
Download and view the complete annual report
Please find page 384 of the 2010 RBS annual report below. You can navigate through the pages in the report by either clicking on the pages listed below, or by using the keyword search tool below to find specific information within the annual report.-
 1
1 -
2
-
3
-
4
-
5
-
6
-
7
-
8
-
9
-
10
-
11
-
12
-
13
-
14
-
15
-
16
-
17
-
18
-
19
-
20
-
21
-
22
-
23
-
24
-
25
-
26
-
27
-
28
-
29
-
30
-
31
-
32
-
33
-
34
-
35
-
36
-
37
-
38
-
39
-
40
-
41
-
42
-
43
-
44
-
45
-
46
-
47
-
48
-
49
-
50
-
51
-
52
-
53
-
54
-
55
-
56
-
57
-
58
-
59
-
60
-
61
-
62
-
63
-
64
-
65
-
66
-
67
-
68
-
69
-
70
-
71
-
72
-
73
-
74
-
75
-
76
-
77
-
78
-
79
-
80
-
81
-
82
-
83
-
84
-
85
-
86
-
87
-
88
-
89
-
90
-
91
-
92
-
93
-
94
-
95
-
96
-
97
-
98
-
99
-
100
-
101
-
102
-
103
-
104
-
105
-
106
-
107
-
108
-
109
-
110
-
111
-
112
-
113
-
114
-
115
-
116
-
117
-
118
-
119
-
120
-
121
-
122
-
123
-
124
-
125
-
126
-
127
-
128
-
129
-
130
-
131
-
132
-
133
-
134
-
135
-
136
-
137
-
138
-
139
-
140
-
141
-
142
-
143
-
144
-
145
-
146
-
147
-
148
-
149
-
150
-
151
-
152
-
153
-
154
-
155
-
156
-
157
-
158
-
159
-
160
-
161
-
162
-
163
-
164
-
165
-
166
-
167
-
168
-
169
-
170
-
171
-
172
-
173
-
174
-
175
-
176
-
177
-
178
-
179
-
180
-
181
-
182
-
183
-
184
-
185
-
186
-
187
-
188
-
189
-
190
-
191
-
192
-
193
-
194
-
195
-
196
-
197
-
198
-
199
-
200
-
201
-
202
-
203
-
204
-
205
-
206
-
207
-
208
-
209
-
210
-
211
-
212
-
213
-
214
-
215
-
216
-
217
-
218
-
219
-
220
-
221
-
222
-
223
-
224
-
225
-
226
-
227
-
228
-
229
-
230
-
231
-
232
-
233
-
234
-
235
-
236
-
237
-
238
-
239
-
240
-
241
-
242
-
243
-
244
-
245
-
246
-
247
-
248
-
249
-
250
-
251
-
252
-
253
-
254
-
255
-
256
-
257
-
258
-
259
-
260
-
261
-
262
-
263
-
264
-
265
-
266
-
267
-
268
-
269
-
270
-
271
-
272
-
273
-
274
-
275
-
276
-
277
-
278
-
279
-
280
-
281
-
282
-
283
-
284
-
285
-
286
-
287
-
288
-
289
-
290
-
291
-
292
-
293
-
294
-
295
-
296
-
297
-
298
-
299
-
300
-
301
-
302
-
303
-
304
-
305
-
306
-
307
-
308
-
309
-
310
-
311
-
312
-
313
-
314
-
315
-
316
-
317
-
318
-
319
-
320
-
321
-
322
-
323
-
324
-
325
-
326
-
327
-
328
-
329
-
330
-
331
-
332
-
333
-
334
-
335
-
336
-
337
-
338
-
339
-
340
-
341
-
342
-
343
-
344
-
345
-
346
-
347
-
348
-
349
-
350
-
351
-
352
-
353
-
354
-
355
-
356
-
357
-
358
-
359
-
360
-
361
-
362
-
363
-
364
-
365
-
366
-
367
-
368
-
369
-
370
-
371
-
372
-
373
-
 374
374 -
 375
375 -
 376
376 -
 377
377 -
 378
378 -
 379
379 -
 380
380 -
 381
381 -
 382
382 -
 383
383 -
 384
384 -
 385
385 -
 386
386 -
 387
387 -
 388
388 -
 389
389 -
 390
390 -
 391
391 -
 392
392 -
 393
393 -
 394
394 -
395
-
396
-
397
-
398
-
399
-
400
-
401
-
402
-
403
-
404
-
405
-
406
-
407
-
408
-
409
-
410
-
411
-
412
-
413
-
414
-
415
-
416
-
417
-
418
-
419
-
420
-
421
-
422
-
423
-
424
-
425
-
426
-
427
-
428
-
429
-
430
-
431
-
432
-
433
-
434
-
435
-
436
-
437
-
438
-
439
-
440
-
441
-
442
-
443
-
444
-
445
 |
 |

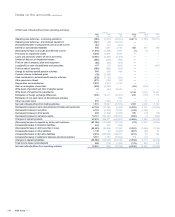
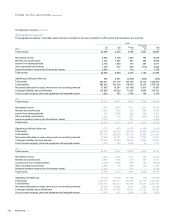
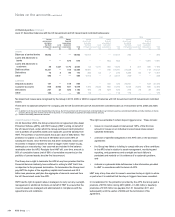
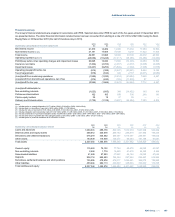
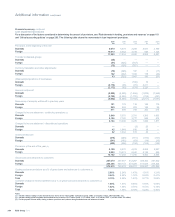
40 Segmental analysis continued
(b) Geographical segments
The geographical analysis in the tables below has been compiled on the basis of location of office where the transactions are recorded.
Group
2010
UK
£m
USA
£m
Europe
£m
Rest of the
World
£m
Total
£m
Total revenue 25,468 8,332 6,196 2,901 42,897
Net interest income 8,932 3,128 1,384 765 14,209
Net fees and commissions 3,272 1,557 591 562 5,982
Income from trading activities 2,106 1,963 197 251 4,517
Other operating income/(loss) 1,376 232 836 (412) 2,032
Insurance premium income (net of reinsurers' share) 4,809 — 319 — 5,128
Total income 20,495 6,880 3,327 1,166 31,868
Operating profit/(loss) before tax 862 2,091 (2,450) (902) (399)
Total assets 932,917 341,770 102,756 76,133 1,453,576
Total liabilities 860,932 323,529 119,946 72,318 1,376,725
Net assets attributable to equity owners and non-controlling interests 71,985 18,241 (17,190) 3,815 76,851
Contingent liabilities and commitments 134,983 98,429 71,025 9,894 314,331
Cost to acquire property, plant and equipment and intangible assets 1,283 355 1,388 109 3,135
2009
Total revenue 28,421 10,517 6,442 3,622 49,002
Net interest income 7,759 2,674 1,741 1,214 13,388
Net fees and commissions 3,640 1,586 316 406 5,948
Income from trading activities 131 2,396 584 650 3,761
Other operating income/(loss) 6,015 (37) (977) (338) 4,663
Insurance premium income (net of reinsurers' share) 4,879 — 387 — 5,266
Total income 22,424 6,619 2,051 1,932 33,026
Operating profit/(loss) before tax 1,776 (457) (2,877) (1,089) (2,647)
Total assets 949,765 338,649 320,008 88,064 1,696,486
Total liabilities 873,716 322,698 321,133 84,308 1,601,855
Net assets attributable to equity owners and non-controlling interests 76,049 15,951 (1,125) 3,756 94,631
Contingent liabilities and commitments 175,392 93,694 65,026 17,549 351,661
Cost to acquire property, plant and equipment and intangible assets 1,974 390 3,252 94 5,710
2008
Total revenue 23,576 8,487 12,293 5,826 50,182
Net interest income 9,923 2,783 1,791 985 15,482
Net fees and commissions 3,687 1,494 735 495 6,411
(Loss)/income from trading activities (7,415) (1,604) (773) 767 (9,025)
Other operating income/(loss) 2,589 45 (464) (17) 2,153
Insurance premium income (net of reinsurers' share) 5,195 — 514 — 5,709
Total income 13,979 2,718 1,803 2,230 20,730
Operating loss before tax (8,036) (5,806) (11,784) (65) (25,691)
Total assets 1,304,714 607,511 368,290 121,137 2,401,652
Total liabilities 1,253,814 592,272 361,590 113,478 2,321,154
Net assets attributable to equity owners and non-controlling interests 50,900 15,239 6,700 7,659 80,498
Contingent liabilities and commitments 200,763 131,435 79,941 21,122 433,261
Cost to acquire property, plant and equipment and intangible assets 3,415 445 2,204 186 6,250
RBS Group 2010382
Notes on the accounts continued