RBS 2010 Annual Report Download - page 314
Download and view the complete annual report
Please find page 314 of the 2010 RBS annual report below. You can navigate through the pages in the report by either clicking on the pages listed below, or by using the keyword search tool below to find specific information within the annual report.-
 1
1 -
2
-
3
-
4
-
5
-
6
-
7
-
8
-
9
-
10
-
11
-
12
-
13
-
14
-
15
-
16
-
17
-
18
-
19
-
20
-
21
-
22
-
23
-
24
-
25
-
26
-
27
-
28
-
29
-
30
-
31
-
32
-
33
-
34
-
35
-
36
-
37
-
38
-
39
-
40
-
41
-
42
-
43
-
44
-
45
-
46
-
47
-
48
-
49
-
50
-
51
-
52
-
53
-
54
-
55
-
56
-
57
-
58
-
59
-
60
-
61
-
62
-
63
-
64
-
65
-
66
-
67
-
68
-
69
-
70
-
71
-
72
-
73
-
74
-
75
-
76
-
77
-
78
-
79
-
80
-
81
-
82
-
83
-
84
-
85
-
86
-
87
-
88
-
89
-
90
-
91
-
92
-
93
-
94
-
95
-
96
-
97
-
98
-
99
-
100
-
101
-
102
-
103
-
104
-
105
-
106
-
107
-
108
-
109
-
110
-
111
-
112
-
113
-
114
-
115
-
116
-
117
-
118
-
119
-
120
-
121
-
122
-
123
-
124
-
125
-
126
-
127
-
128
-
129
-
130
-
131
-
132
-
133
-
134
-
135
-
136
-
137
-
138
-
139
-
140
-
141
-
142
-
143
-
144
-
145
-
146
-
147
-
148
-
149
-
150
-
151
-
152
-
153
-
154
-
155
-
156
-
157
-
158
-
159
-
160
-
161
-
162
-
163
-
164
-
165
-
166
-
167
-
168
-
169
-
170
-
171
-
172
-
173
-
174
-
175
-
176
-
177
-
178
-
179
-
180
-
181
-
182
-
183
-
184
-
185
-
186
-
187
-
188
-
189
-
190
-
191
-
192
-
193
-
194
-
195
-
196
-
197
-
198
-
199
-
200
-
201
-
202
-
203
-
204
-
205
-
206
-
207
-
208
-
209
-
210
-
211
-
212
-
213
-
214
-
215
-
216
-
217
-
218
-
219
-
220
-
221
-
222
-
223
-
224
-
225
-
226
-
227
-
228
-
229
-
230
-
231
-
232
-
233
-
234
-
235
-
236
-
237
-
238
-
239
-
240
-
241
-
242
-
243
-
244
-
245
-
246
-
247
-
248
-
249
-
250
-
251
-
252
-
253
-
254
-
255
-
256
-
257
-
258
-
259
-
260
-
261
-
262
-
263
-
264
-
265
-
266
-
267
-
268
-
269
-
270
-
271
-
272
-
273
-
274
-
275
-
276
-
277
-
278
-
279
-
280
-
281
-
282
-
283
-
284
-
285
-
286
-
287
-
288
-
289
-
290
-
291
-
292
-
293
-
294
-
295
-
296
-
297
-
298
-
299
-
300
-
301
-
302
-
303
-
 304
304 -
 305
305 -
 306
306 -
 307
307 -
 308
308 -
 309
309 -
 310
310 -
 311
311 -
 312
312 -
 313
313 -
 314
314 -
 315
315 -
 316
316 -
 317
317 -
 318
318 -
 319
319 -
 320
320 -
 321
321 -
 322
322 -
 323
323 -
 324
324 -
325
-
326
-
327
-
328
-
329
-
330
-
331
-
332
-
333
-
334
-
335
-
336
-
337
-
338
-
339
-
340
-
341
-
342
-
343
-
344
-
345
-
346
-
347
-
348
-
349
-
350
-
351
-
352
-
353
-
354
-
355
-
356
-
357
-
358
-
359
-
360
-
361
-
362
-
363
-
364
-
365
-
366
-
367
-
368
-
369
-
370
-
371
-
372
-
373
-
374
-
375
-
376
-
377
-
378
-
379
-
380
-
381
-
382
-
383
-
384
-
385
-
386
-
387
-
388
-
389
-
390
-
391
-
392
-
393
-
394
-
395
-
396
-
397
-
398
-
399
-
400
-
401
-
402
-
403
-
404
-
405
-
406
-
407
-
408
-
409
-
410
-
411
-
412
-
413
-
414
-
415
-
416
-
417
-
418
-
419
-
420
-
421
-
422
-
423
-
424
-
425
-
426
-
427
-
428
-
429
-
430
-
431
-
432
-
433
-
434
-
435
-
436
-
437
-
438
-
439
-
440
-
441
-
442
-
443
-
444
-
445
 |
 |

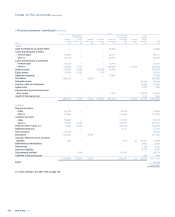
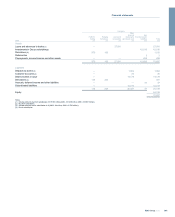
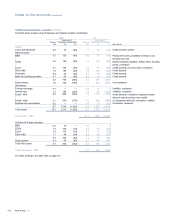
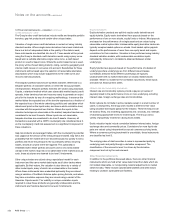
12 Financial instruments - valuation continued
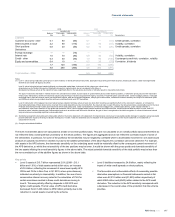
Valuation reserves
When valuing financial instruments in the trading book, adjustments are made to mid-market valuations to cover bid-offer spread, liquidity and credit risk.
The table below shows the valuation reserves and adjustments.
2010
£m
2009
£m
2008
£m
Credit valuation adjustments
Monoline insurers 2,443 3,796 5,988
Credit derivative product companies 490 499 1,311
Other counterparties 1,714 1,588 1,738
4,647 5,883 9,037
Bid-offer and liquidity reserves 2,797 2,814 3,260
7,444 8,697 12,297
Credit valuation adjustments (CVA)
Credit valuation adjustments represent an estimate of the adjustment to
fair value that a market participant would make to incorporate the credit
risk inherent in counterparty derivative exposures. The Group makes
such credit adjustments to derivative exposures it has to counterparties,
as well as debit valuation adjustments to liabilities issued by the Group.
CVA is discussed in Risk and balance sheet management - Other risk
exposures - Credit valuation adjustments (pages 211 to 215).
Bid-offer and liquidity reserves
Fair value positions are adjusted to bid (for assets) or offer (for liabilities)
levels, by marking individual cash based positions directly to bid or offer
or by taking bid-offer reserves calculated on a portfolio basis for
derivatives.
The bid-offer approach is based on current market spreads and standard
market bucketing of risk. Risk data is used as the primary source of
information within bid-offer calculations and is aggregated when it is more
granular than market standard buckets.
Bid-offer adjustments for each risk factor are determined by aggregating
similar risk exposures arising on different products. Additional basis
bid/offer reserves are taken where these are charged in the market. Risk
associated with non identical underlying exposures is not netted down
unless there is evidence that the cost of closing the combined risk
exposure is less than the cost of closing on an individual basis. For
example: interest rate delta bid-offer methodology (when viewed in
isolation) allows aggregation of risk across different tenor bases. Tenor
basis bid-offer reserves are then applied to compensate for the netting
within the (original) delta bid-offer calculation.
Bid-offer spreads vary by maturity and risk type to reflect different
spreads in the market. For positions where there is no observable quote,
the bid-offer spreads are widened in comparison to proxies to reflect
reduced liquidity or observability. Bid-offer methodologies also
incorporate liquidity triggers whereby wider spreads are applied to risks
above pre-defined thresholds.
Netting is applied across risk buckets where there is market evidence to
support this. For example, calendar netting and cross strike netting
effects are taken into account where such trades occur regularly within
the market. Netting will also apply where long and short risk in two
different risk buckets can be closed out in a single market transaction at
less cost than by way of two separate transactions (closing out the
individual bucketed risk in isolation).
Vanilla risk on exotic products is typically reserved as part of the overall
portfolio based calculation e.g. delta and vega risk is included within the
delta and vega bid-offer calculations. Aggregation of risk arising from
different models is in line with the Group's risk management practices;
the model review control process considers the appropriateness of model
selection in this respect.
Product related risks such as correlation risk attract specific bid-offer
reserves. Additional reserves are provided for exotic products to ensure
overall reserves match market close-out costs. These market close-out
costs inherently incorporate risk decay and cross-effects which are
unlikely to be adequately reflected in static hedges based on vanilla
instruments.
Where there is limited bid-offer information for a product, a conservative
approach is adopted, taking into account pricing approach and risk
management strategy.
Derivative discounting
The market convention for some derivative products has moved to pricing
collateralised derivatives using the overnight indexed swap (OIS) curve,
which reflects the interest rate typically paid on cash collateral. In order to
reflect observed market practice the Group’s valuation approach for the
substantial portion of its collateralised derivatives was amended to use
OIS. Previously the Group had discounted these collateralised derivatives
based on LIBOR. The rate for discounting uncollateralised derivatives
was also changed in line with observable market pricing. This change
resulted in a net increase in income from trading activities of £127 million
for 2010.
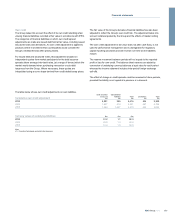
Amounts deferred on initial recognition
On initial recognition of financial assets and liabilities valued using
valuation techniques incorporating information other than observable
market data, any difference between the transaction price and that
derived from the valuation technique is deferred. Such amounts are
recognised in profit or loss over the life of the transaction; when market
data becomes observable; or when the transaction matures or is closed
out as appropriate. At 31 December 2010, net gains of £167 million (2009
-£204 million; 2008 - £102 million) were carried forward in the balance
sheet. During the year net gains of £62 million (2009 - £127 million; 2008
-£89 million) were deferred and £99 million (2009 - £25 million; 2008 -
£65 million) recognised in the income statement.
RBS Group 2010312
Notes on the accounts continued