RBS 2010 Annual Report Download - page 90
Download and view the complete annual report
Please find page 90 of the 2010 RBS annual report below. You can navigate through the pages in the report by either clicking on the pages listed below, or by using the keyword search tool below to find specific information within the annual report.-
 1
1 -
2
-
3
-
4
-
5
-
6
-
7
-
8
-
9
-
10
-
11
-
12
-
13
-
14
-
15
-
16
-
17
-
18
-
19
-
20
-
21
-
22
-
23
-
24
-
25
-
26
-
27
-
28
-
29
-
30
-
31
-
32
-
33
-
34
-
35
-
36
-
37
-
38
-
39
-
40
-
41
-
42
-
43
-
44
-
45
-
46
-
47
-
48
-
49
-
50
-
51
-
52
-
53
-
54
-
55
-
56
-
57
-
58
-
59
-
60
-
61
-
62
-
63
-
64
-
65
-
66
-
67
-
68
-
69
-
70
-
71
-
72
-
73
-
74
-
75
-
76
-
77
-
78
-
79
-
 80
80 -
 81
81 -
 82
82 -
 83
83 -
 84
84 -
 85
85 -
 86
86 -
 87
87 -
 88
88 -
 89
89 -
 90
90 -
 91
91 -
 92
92 -
 93
93 -
 94
94 -
 95
95 -
 96
96 -
 97
97 -
 98
98 -
 99
99 -
 100
100 -
101
-
102
-
103
-
104
-
105
-
106
-
107
-
108
-
109
-
110
-
111
-
112
-
113
-
114
-
115
-
116
-
117
-
118
-
119
-
120
-
121
-
122
-
123
-
124
-
125
-
126
-
127
-
128
-
129
-
130
-
131
-
132
-
133
-
134
-
135
-
136
-
137
-
138
-
139
-
140
-
141
-
142
-
143
-
144
-
145
-
146
-
147
-
148
-
149
-
150
-
151
-
152
-
153
-
154
-
155
-
156
-
157
-
158
-
159
-
160
-
161
-
162
-
163
-
164
-
165
-
166
-
167
-
168
-
169
-
170
-
171
-
172
-
173
-
174
-
175
-
176
-
177
-
178
-
179
-
180
-
181
-
182
-
183
-
184
-
185
-
186
-
187
-
188
-
189
-
190
-
191
-
192
-
193
-
194
-
195
-
196
-
197
-
198
-
199
-
200
-
201
-
202
-
203
-
204
-
205
-
206
-
207
-
208
-
209
-
210
-
211
-
212
-
213
-
214
-
215
-
216
-
217
-
218
-
219
-
220
-
221
-
222
-
223
-
224
-
225
-
226
-
227
-
228
-
229
-
230
-
231
-
232
-
233
-
234
-
235
-
236
-
237
-
238
-
239
-
240
-
241
-
242
-
243
-
244
-
245
-
246
-
247
-
248
-
249
-
250
-
251
-
252
-
253
-
254
-
255
-
256
-
257
-
258
-
259
-
260
-
261
-
262
-
263
-
264
-
265
-
266
-
267
-
268
-
269
-
270
-
271
-
272
-
273
-
274
-
275
-
276
-
277
-
278
-
279
-
280
-
281
-
282
-
283
-
284
-
285
-
286
-
287
-
288
-
289
-
290
-
291
-
292
-
293
-
294
-
295
-
296
-
297
-
298
-
299
-
300
-
301
-
302
-
303
-
304
-
305
-
306
-
307
-
308
-
309
-
310
-
311
-
312
-
313
-
314
-
315
-
316
-
317
-
318
-
319
-
320
-
321
-
322
-
323
-
324
-
325
-
326
-
327
-
328
-
329
-
330
-
331
-
332
-
333
-
334
-
335
-
336
-
337
-
338
-
339
-
340
-
341
-
342
-
343
-
344
-
345
-
346
-
347
-
348
-
349
-
350
-
351
-
352
-
353
-
354
-
355
-
356
-
357
-
358
-
359
-
360
-
361
-
362
-
363
-
364
-
365
-
366
-
367
-
368
-
369
-
370
-
371
-
372
-
373
-
374
-
375
-
376
-
377
-
378
-
379
-
380
-
381
-
382
-
383
-
384
-
385
-
386
-
387
-
388
-
389
-
390
-
391
-
392
-
393
-
394
-
395
-
396
-
397
-
398
-
399
-
400
-
401
-
402
-
403
-
404
-
405
-
406
-
407
-
408
-
409
-
410
-
411
-
412
-
413
-
414
-
415
-
416
-
417
-
418
-
419
-
420
-
421
-
422
-
423
-
424
-
425
-
426
-
427
-
428
-
429
-
430
-
431
-
432
-
433
-
434
-
435
-
436
-
437
-
438
-
439
-
440
-
441
-
442
-
443
-
444
-
445
 |
 |
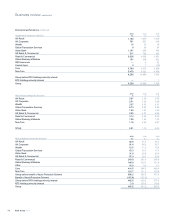
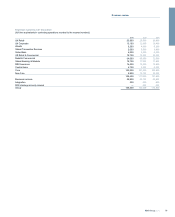
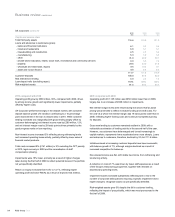
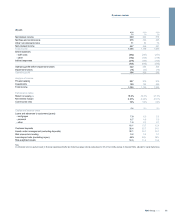
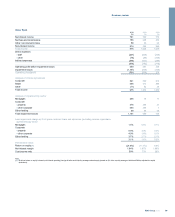
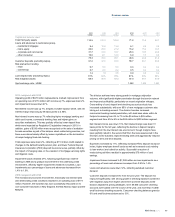
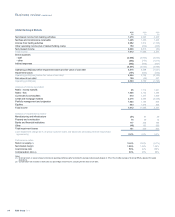
Global Transaction Services continued
2010 compared with 2009
Operating profit increased 12%, or 10% on a constant foreign exchange
basis, driven by a robust income performance (which has more than
compensated for the loss of Global Merchant Services (GMS) income),
good cost control and lower impairments. Adjusting for the disposal
operating profit increased 21%.
For the eleven months before disposal, GTS booked income of £451
million and total expenses of £244 million for GMS, generating an
operating profit of £207 million.
Income was up 3%, or 6% excluding GMS, reflecting higher deposit
volumes in the International Cash Management business, growth in the
Trade Finance business and improved Commercial Card transaction
volumes.
Expenses were broadly in line with 2009, at £1,464 million, as increased
investment in front office and support infrastructure was mitigated by tight
management of business costs.
Third party assets increased by £6.8 billion, or £7.6 billion excluding
GMS, as Yen clearing activities were brought in-house and loans and
advances increased.
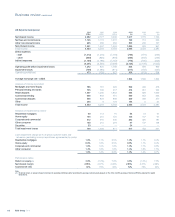
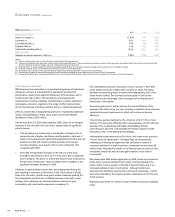
2009 compared with 2008
Operating profit declined by 3%, or 6% at constant foreign exchange
rates, largely reflecting pressure on deposit income. The attrition of
deposit balances experienced in the first half was reversed in the second,
but margins remain compressed due to both a very competitive deposit
market as well as the low rate environment.
Customer deposit balances at £61.8 billion were flat on the previous year,
with growth in the UK and international business offset by weaker US
domestic balances. At constant exchange rates balances were up 3%.
Loans and advances were down 14% (11% in constant currency terms)
due to reduced overdraft utilisation and lower trade volumes.
At constant exchange rates, international payment fees increased by
11%, while trade finance income increased by 8%, with improved
penetration in the Asia-Pacific region. Merchant acquiring income,
however, declined by 9% at constant exchange rates, as consumers
continued to switch to lower margin debit card transactions in preference
to using credit cards.
Expenses were up 7% in headline terms but flat in constant currency
terms, as cost savings and efficiencies helped to mitigate the impact of
investment in infrastructure. Staff expenses were 2% lower in constant
currency terms, with headcount down 5%. The cost:income ratio was
59%, a deterioration of 2.7 percentage points or 1.9 percentage points in
constant currency terms.
Impairment losses were £39 million, down £15 million versus 2008.
Overall defaults remain modest at 0.3% of loans and advances.
RBS Group 201088
Business review continued