RBS 2010 Annual Report Download - page 303
Download and view the complete annual report
Please find page 303 of the 2010 RBS annual report below. You can navigate through the pages in the report by either clicking on the pages listed below, or by using the keyword search tool below to find specific information within the annual report.-
 1
1 -
2
-
3
-
4
-
5
-
6
-
7
-
8
-
9
-
10
-
11
-
12
-
13
-
14
-
15
-
16
-
17
-
18
-
19
-
20
-
21
-
22
-
23
-
24
-
25
-
26
-
27
-
28
-
29
-
30
-
31
-
32
-
33
-
34
-
35
-
36
-
37
-
38
-
39
-
40
-
41
-
42
-
43
-
44
-
45
-
46
-
47
-
48
-
49
-
50
-
51
-
52
-
53
-
54
-
55
-
56
-
57
-
58
-
59
-
60
-
61
-
62
-
63
-
64
-
65
-
66
-
67
-
68
-
69
-
70
-
71
-
72
-
73
-
74
-
75
-
76
-
77
-
78
-
79
-
80
-
81
-
82
-
83
-
84
-
85
-
86
-
87
-
88
-
89
-
90
-
91
-
92
-
93
-
94
-
95
-
96
-
97
-
98
-
99
-
100
-
101
-
102
-
103
-
104
-
105
-
106
-
107
-
108
-
109
-
110
-
111
-
112
-
113
-
114
-
115
-
116
-
117
-
118
-
119
-
120
-
121
-
122
-
123
-
124
-
125
-
126
-
127
-
128
-
129
-
130
-
131
-
132
-
133
-
134
-
135
-
136
-
137
-
138
-
139
-
140
-
141
-
142
-
143
-
144
-
145
-
146
-
147
-
148
-
149
-
150
-
151
-
152
-
153
-
154
-
155
-
156
-
157
-
158
-
159
-
160
-
161
-
162
-
163
-
164
-
165
-
166
-
167
-
168
-
169
-
170
-
171
-
172
-
173
-
174
-
175
-
176
-
177
-
178
-
179
-
180
-
181
-
182
-
183
-
184
-
185
-
186
-
187
-
188
-
189
-
190
-
191
-
192
-
193
-
194
-
195
-
196
-
197
-
198
-
199
-
200
-
201
-
202
-
203
-
204
-
205
-
206
-
207
-
208
-
209
-
210
-
211
-
212
-
213
-
214
-
215
-
216
-
217
-
218
-
219
-
220
-
221
-
222
-
223
-
224
-
225
-
226
-
227
-
228
-
229
-
230
-
231
-
232
-
233
-
234
-
235
-
236
-
237
-
238
-
239
-
240
-
241
-
242
-
243
-
244
-
245
-
246
-
247
-
248
-
249
-
250
-
251
-
252
-
253
-
254
-
255
-
256
-
257
-
258
-
259
-
260
-
261
-
262
-
263
-
264
-
265
-
266
-
267
-
268
-
269
-
270
-
271
-
272
-
273
-
274
-
275
-
276
-
277
-
278
-
279
-
280
-
281
-
282
-
283
-
284
-
285
-
286
-
287
-
288
-
289
-
290
-
291
-
292
-
 293
293 -
 294
294 -
 295
295 -
 296
296 -
 297
297 -
 298
298 -
 299
299 -
 300
300 -
 301
301 -
 302
302 -
 303
303 -
 304
304 -
 305
305 -
 306
306 -
 307
307 -
 308
308 -
 309
309 -
 310
310 -
 311
311 -
 312
312 -
 313
313 -
314
-
315
-
316
-
317
-
318
-
319
-
320
-
321
-
322
-
323
-
324
-
325
-
326
-
327
-
328
-
329
-
330
-
331
-
332
-
333
-
334
-
335
-
336
-
337
-
338
-
339
-
340
-
341
-
342
-
343
-
344
-
345
-
346
-
347
-
348
-
349
-
350
-
351
-
352
-
353
-
354
-
355
-
356
-
357
-
358
-
359
-
360
-
361
-
362
-
363
-
364
-
365
-
366
-
367
-
368
-
369
-
370
-
371
-
372
-
373
-
374
-
375
-
376
-
377
-
378
-
379
-
380
-
381
-
382
-
383
-
384
-
385
-
386
-
387
-
388
-
389
-
390
-
391
-
392
-
393
-
394
-
395
-
396
-
397
-
398
-
399
-
400
-
401
-
402
-
403
-
404
-
405
-
406
-
407
-
408
-
409
-
410
-
411
-
412
-
413
-
414
-
415
-
416
-
417
-
418
-
419
-
420
-
421
-
422
-
423
-
424
-
425
-
426
-
427
-
428
-
429
-
430
-
431
-
432
-
433
-
434
-
435
-
436
-
437
-
438
-
439
-
440
-
441
-
442
-
443
-
444
-
445
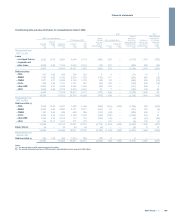
 |
 |

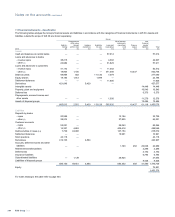
Group
Held-for-
trading
Designated as
at fair value
through
profit or loss
Hedging
derivatives
Available-
for-sale
Loans and
receivables
Other financial
instruments
(amortised
cost)
Finance
leases
Non
financial
assets/
liabilities Total
2009 £m £m £m £m £m £m £m £m £m
Assets
Cash and balances at central banks — — — 52,261 52,261
Loans and advances to banks
- reverse repos 26,886 — — 8,211 35,097
- other (1) 18,563 — — 38,093 56,656
Loans and advances to customers
- reverse repos 26,313 — — 14,727 41,040
- other (2) 15,964 1,981 — 656,310 13,098 687,353
Debt securities 111,482 2,603 143,298 9,871 267,254
Equity shares 14,443 2,192 2,893 — 19,528
Settlement balances — — — 12,033 12,033
Derivatives 436,857 4,597 441,454
Intangible assets 17,847 17,847
Property, plant and equipment 19,397 19,397
Deferred tax 7,039 7,039
Prepayments, accrued income and
other assets — — — 1,421 19,564 20,985
Assets of disposal groups 18,542 18,542
650,508 6,776 4,597 146,191 792,927 13,098 82,389 1,696,486
Liabilities
Deposits by banks
- repos 20,962 — 17,044 38,006
- other (3) 32,647 — 71,491 104,138
Customer accounts
- repos 41,520 — 26,833 68,353
- other (4) 11,348 8,580 525,921 545,849
Debt securities in issue (5,6) 3,925 41,537 222,106 267,568
Settlement balances — — 10,413 10,413
Short positions 40,463 — 40,463
Derivatives 417,634 6,507 424,141
Accruals, deferred income and other
liabilities — — 1,889 467 27,971 30,327
Retirement benefit liabilities 2,963 2,963
Deferred tax 2,811 2,811
Insurance liabilities 10,281 10,281
Subordinated liabilities — 1,277 36,375 37,652
Liabilities of disposal groups 18,890 18,890
568,499 51,394 6,507 912,072 467 62,916 1,601,855
Equity 94,631
1,696,486
For notes relating to this table refer to page 303.
301RBS Group 2010
Financial statements