RBS 2010 Annual Report Download - page 323
Download and view the complete annual report
Please find page 323 of the 2010 RBS annual report below. You can navigate through the pages in the report by either clicking on the pages listed below, or by using the keyword search tool below to find specific information within the annual report.-
 1
1 -
2
-
3
-
4
-
5
-
6
-
7
-
8
-
9
-
10
-
11
-
12
-
13
-
14
-
15
-
16
-
17
-
18
-
19
-
20
-
21
-
22
-
23
-
24
-
25
-
26
-
27
-
28
-
29
-
30
-
31
-
32
-
33
-
34
-
35
-
36
-
37
-
38
-
39
-
40
-
41
-
42
-
43
-
44
-
45
-
46
-
47
-
48
-
49
-
50
-
51
-
52
-
53
-
54
-
55
-
56
-
57
-
58
-
59
-
60
-
61
-
62
-
63
-
64
-
65
-
66
-
67
-
68
-
69
-
70
-
71
-
72
-
73
-
74
-
75
-
76
-
77
-
78
-
79
-
80
-
81
-
82
-
83
-
84
-
85
-
86
-
87
-
88
-
89
-
90
-
91
-
92
-
93
-
94
-
95
-
96
-
97
-
98
-
99
-
100
-
101
-
102
-
103
-
104
-
105
-
106
-
107
-
108
-
109
-
110
-
111
-
112
-
113
-
114
-
115
-
116
-
117
-
118
-
119
-
120
-
121
-
122
-
123
-
124
-
125
-
126
-
127
-
128
-
129
-
130
-
131
-
132
-
133
-
134
-
135
-
136
-
137
-
138
-
139
-
140
-
141
-
142
-
143
-
144
-
145
-
146
-
147
-
148
-
149
-
150
-
151
-
152
-
153
-
154
-
155
-
156
-
157
-
158
-
159
-
160
-
161
-
162
-
163
-
164
-
165
-
166
-
167
-
168
-
169
-
170
-
171
-
172
-
173
-
174
-
175
-
176
-
177
-
178
-
179
-
180
-
181
-
182
-
183
-
184
-
185
-
186
-
187
-
188
-
189
-
190
-
191
-
192
-
193
-
194
-
195
-
196
-
197
-
198
-
199
-
200
-
201
-
202
-
203
-
204
-
205
-
206
-
207
-
208
-
209
-
210
-
211
-
212
-
213
-
214
-
215
-
216
-
217
-
218
-
219
-
220
-
221
-
222
-
223
-
224
-
225
-
226
-
227
-
228
-
229
-
230
-
231
-
232
-
233
-
234
-
235
-
236
-
237
-
238
-
239
-
240
-
241
-
242
-
243
-
244
-
245
-
246
-
247
-
248
-
249
-
250
-
251
-
252
-
253
-
254
-
255
-
256
-
257
-
258
-
259
-
260
-
261
-
262
-
263
-
264
-
265
-
266
-
267
-
268
-
269
-
270
-
271
-
272
-
273
-
274
-
275
-
276
-
277
-
278
-
279
-
280
-
281
-
282
-
283
-
284
-
285
-
286
-
287
-
288
-
289
-
290
-
291
-
292
-
293
-
294
-
295
-
296
-
297
-
298
-
299
-
300
-
301
-
302
-
303
-
304
-
305
-
306
-
307
-
308
-
309
-
310
-
311
-
312
-
 313
313 -
 314
314 -
 315
315 -
 316
316 -
 317
317 -
 318
318 -
 319
319 -
 320
320 -
 321
321 -
 322
322 -
 323
323 -
 324
324 -
 325
325 -
 326
326 -
 327
327 -
 328
328 -
 329
329 -
 330
330 -
 331
331 -
 332
332 -
 333
333 -
334
-
335
-
336
-
337
-
338
-
339
-
340
-
341
-
342
-
343
-
344
-
345
-
346
-
347
-
348
-
349
-
350
-
351
-
352
-
353
-
354
-
355
-
356
-
357
-
358
-
359
-
360
-
361
-
362
-
363
-
364
-
365
-
366
-
367
-
368
-
369
-
370
-
371
-
372
-
373
-
374
-
375
-
376
-
377
-
378
-
379
-
380
-
381
-
382
-
383
-
384
-
385
-
386
-
387
-
388
-
389
-
390
-
391
-
392
-
393
-
394
-
395
-
396
-
397
-
398
-
399
-
400
-
401
-
402
-
403
-
404
-
405
-
406
-
407
-
408
-
409
-
410
-
411
-
412
-
413
-
414
-
415
-
416
-
417
-
418
-
419
-
420
-
421
-
422
-
423
-
424
-
425
-
426
-
427
-
428
-
429
-
430
-
431
-
432
-
433
-
434
-
435
-
436
-
437
-
438
-
439
-
440
-
441
-
442
-
443
-
444
-
445
 |
 |

The model primarily uses the following inputs in relation to each individual
asset: notional, maturity, probability of default and expected recovery rate
given default. Other key inputs include: the correlation between the
underlying assets; the range of possible recovery rates on the underlying
assets (“alpha”); the size of the first loss; and the level of expected losses
on covered assets that have been sold, that can be treated as losses for
the purpose of the APS (“loss credits”).
During 2010, refinements were made to the treatment of derivative trades
in the valuation model. This followed a change in the nature of protection
provided in relation to certain structured credit trades involving mainly
asset backed securities and associated bought protection credit
derivatives: the risk of losses arising on the derivative trades due to
counterparty risk was replaced by the risk of incurring losses on the
underlying asset backed securities that are not recovered through the
derivative trades. The valuation refinements were made to accurately
reflect the impact of this change and ensure a consistent treatment
across all derivative trades.
The APS protects a wide range of asset types, and hence, the correlation
between the underlying assets cannot be observed from market data. In
the absence of this, the Group determines a reasonable level for this
input. The expected recovery rate given default is based on internally
assessed levels. The probability of default is calculated with reference to
data observable in the market. Where possible, data is obtained for each
asset within the APS, but for most of the assets, such observable data
does not exist. In these cases, this important input is determined from
information available for similar entities by geography and rating. The
approach for doing this was refined during the year in order to accurately
reflect both changes in market conditions and the profile of the portfolio of
covered assets.
As the inputs into the valuation model are not all observable the APS
derivative is a level 3 asset. The fair value of the credit protection at 31
December 2010 was £0.55 billion (2009 - £1.40 billion).
The Group has used the following reasonably possible alternative
assumptions in relation to those inputs that could have a significant effect
on the valuation of the APS:
Correlation: +/- 10%
The correlation uncertainty relates to both the nature of the underlying
portfolio and the seniority of protection. The +/-10% correlation range
looks reasonable in light of market observable correlations of similar
levels of protection seniority, for portfolios of investment grade and high
yield assets.
Range of possible recovery rates on underlying assets (alpha): +/- 10%
The level of alpha used in the valuation of the APS is in line with that
used to value tranches traded by the exotic credit desk and assumes that
the underlying assets have a wide range of potential recovery rates. As
the APS protects a wider range of asset classes than is generally
referenced by exotic credit trades, there is uncertainty in relation to this
approach. A comparison of actual recoveries to expected recoveries
supports the approach adopted and, in light of this, only changes of +/-
10% in the assumed width of this range are considered reasonable.
Credit spreads: +/- 10%
The credit spread uncertainty relates to determining the probability of
default for assets where there is no such observable data in the market.
An analysis of the impact on credit spreads of small changes in the
ratings assumptions in key geographic regions indicated that overall
credit spread movements in the +/- 10% range look reasonable.
Discount curve: +/- 1%
Due to the long-dated contractual maturity of the APS, and the
requirement to pay fixed levels of premiums each year, the valuation is
sensitive to long-term interest rates. Valuation uncertainty arises due to
the illiquidity of such interest rates. An interest rate range of +/- 1% is
considered reasonable.
Loss credits: +/- 10%
The level of expected losses on covered assets that have been sold that
can be treated as losses for the purpose of the APS are assessed by the
Asset Protection Agency. For disposals made by the Group where this
assessment has not been completed, the Group makes an estimate of
the likely assessment for the purpose of valuing of the APS. A range of
+/- 10% in the level of assessment is considered reasonable.
Using the above reasonably possible alternative assumptions, the fair
value of the APS derivative could be higher by approximately £860 million
or lower by approximately £940 million as detailed in the table below.
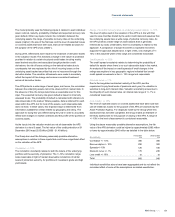
Sensitivity Favourable
£m
Unfavourable
£m
Correlation +/- 10% 300 300
Recover alpha +/- 10% 250 300
Spreads +/-10% 125 100
Discount curve +/- 1% 175 230
Loss credit +/- 10% 10 10
Total 860 940
Individual sensitivities above have been aggregated and do not reflect the
correlated effect of some of the assumptions as related sensitivities.
321RBS Group 2010
Financial statements