RBS 2010 Annual Report Download - page 337
Download and view the complete annual report
Please find page 337 of the 2010 RBS annual report below. You can navigate through the pages in the report by either clicking on the pages listed below, or by using the keyword search tool below to find specific information within the annual report.-
 1
1 -
2
-
3
-
4
-
5
-
6
-
7
-
8
-
9
-
10
-
11
-
12
-
13
-
14
-
15
-
16
-
17
-
18
-
19
-
20
-
21
-
22
-
23
-
24
-
25
-
26
-
27
-
28
-
29
-
30
-
31
-
32
-
33
-
34
-
35
-
36
-
37
-
38
-
39
-
40
-
41
-
42
-
43
-
44
-
45
-
46
-
47
-
48
-
49
-
50
-
51
-
52
-
53
-
54
-
55
-
56
-
57
-
58
-
59
-
60
-
61
-
62
-
63
-
64
-
65
-
66
-
67
-
68
-
69
-
70
-
71
-
72
-
73
-
74
-
75
-
76
-
77
-
78
-
79
-
80
-
81
-
82
-
83
-
84
-
85
-
86
-
87
-
88
-
89
-
90
-
91
-
92
-
93
-
94
-
95
-
96
-
97
-
98
-
99
-
100
-
101
-
102
-
103
-
104
-
105
-
106
-
107
-
108
-
109
-
110
-
111
-
112
-
113
-
114
-
115
-
116
-
117
-
118
-
119
-
120
-
121
-
122
-
123
-
124
-
125
-
126
-
127
-
128
-
129
-
130
-
131
-
132
-
133
-
134
-
135
-
136
-
137
-
138
-
139
-
140
-
141
-
142
-
143
-
144
-
145
-
146
-
147
-
148
-
149
-
150
-
151
-
152
-
153
-
154
-
155
-
156
-
157
-
158
-
159
-
160
-
161
-
162
-
163
-
164
-
165
-
166
-
167
-
168
-
169
-
170
-
171
-
172
-
173
-
174
-
175
-
176
-
177
-
178
-
179
-
180
-
181
-
182
-
183
-
184
-
185
-
186
-
187
-
188
-
189
-
190
-
191
-
192
-
193
-
194
-
195
-
196
-
197
-
198
-
199
-
200
-
201
-
202
-
203
-
204
-
205
-
206
-
207
-
208
-
209
-
210
-
211
-
212
-
213
-
214
-
215
-
216
-
217
-
218
-
219
-
220
-
221
-
222
-
223
-
224
-
225
-
226
-
227
-
228
-
229
-
230
-
231
-
232
-
233
-
234
-
235
-
236
-
237
-
238
-
239
-
240
-
241
-
242
-
243
-
244
-
245
-
246
-
247
-
248
-
249
-
250
-
251
-
252
-
253
-
254
-
255
-
256
-
257
-
258
-
259
-
260
-
261
-
262
-
263
-
264
-
265
-
266
-
267
-
268
-
269
-
270
-
271
-
272
-
273
-
274
-
275
-
276
-
277
-
278
-
279
-
280
-
281
-
282
-
283
-
284
-
285
-
286
-
287
-
288
-
289
-
290
-
291
-
292
-
293
-
294
-
295
-
296
-
297
-
298
-
299
-
300
-
301
-
302
-
303
-
304
-
305
-
306
-
307
-
308
-
309
-
310
-
311
-
312
-
313
-
314
-
315
-
316
-
317
-
318
-
319
-
320
-
321
-
322
-
323
-
324
-
325
-
326
-
 327
327 -
 328
328 -
 329
329 -
 330
330 -
 331
331 -
 332
332 -
 333
333 -
 334
334 -
 335
335 -
 336
336 -
 337
337 -
 338
338 -
 339
339 -
 340
340 -
 341
341 -
 342
342 -
 343
343 -
 344
344 -
 345
345 -
 346
346 -
 347
347 -
348
-
349
-
350
-
351
-
352
-
353
-
354
-
355
-
356
-
357
-
358
-
359
-
360
-
361
-
362
-
363
-
364
-
365
-
366
-
367
-
368
-
369
-
370
-
371
-
372
-
373
-
374
-
375
-
376
-
377
-
378
-
379
-
380
-
381
-
382
-
383
-
384
-
385
-
386
-
387
-
388
-
389
-
390
-
391
-
392
-
393
-
394
-
395
-
396
-
397
-
398
-
399
-
400
-
401
-
402
-
403
-
404
-
405
-
406
-
407
-
408
-
409
-
410
-
411
-
412
-
413
-
414
-
415
-
416
-
417
-
418
-
419
-
420
-
421
-
422
-
423
-
424
-
425
-
426
-
427
-
428
-
429
-
430
-
431
-
432
-
433
-
434
-
435
-
436
-
437
-
438
-
439
-
440
-
441
-
442
-
443
-
444
-
445
 |
 |

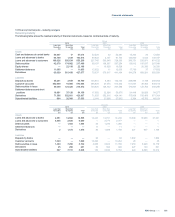
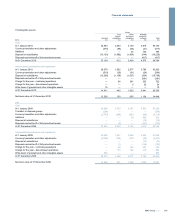
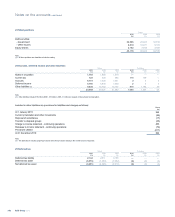
19 Intangible assets
Group
Goodwill
Core
deposit
intangibles
Other
purchased
intangibles
Internally
generated
software Total
2010 £m £m £m £m £m
Cost
At 1 January 2010 42,643 2,553 4,139 4,815 54,150
Currency translation and other adjustments (374) (59) (63) (21) (517)
Additions — — 46 742 788
Disposal of subsidiaries (15,130) (1,882) (1,664) (544) (19,220)
Disposals and write-off of fully amortised assets — — — (417) (417)
At 31 December 2010 27,139 612 2,458 4,575 34,784
Accumulated amortisation and impairment
At 1 January 2010 28,379 1,562 2,577 3,785 36,303
Currency translation and other adjustments (510) (29) (31) (24) (594)
Disposal of subsidiaries (13,268) (1,139) (1,027) (304) (15,738)
Disposals and write-off of fully amortised assets — — — (391) (391)
Charge for the year - continuing operations —68 301 353 722
Charge for the year - discontinued operations — — 2 22 24
Write down of goodwill and other intangible assets 10 — — — 10
At 31 December 2010 14,611 462 1,822 3,441 20,336
Net book value at 31 December 2010 12,528 150 636 1,134 14,448
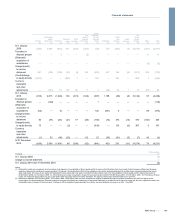
2009
Cost
At 1 January 2009 45,624 2,780 4,367 4,524 57,295
Transfers to disposal groups (238) — — — (238)
Currency translation and other adjustments (2,743) (225) (281) (65) (3,314)
Additions — — 53 559 612
Disposal of subsidiaries — — — (16) (16)
Disposals and write-off of fully amortised assets —(2) — (187) (189)
At 31 December 2009 42,643 2,553 4,139 4,815 54,150
Accumulated amortisation and impairment
At 1 January 2009 30,062 1,407 2,369 3,408 37,246
Currency translation and other adjustments (2,046) (106) (137) (58) (2,347)
Disposal of subsidiaries — — — (13) (13)
Disposals and write-off of fully amortised assets —(1) — (138) (139)
Charge for the year - continuing operations —89 183 467 739
Charge for the year - discontinued operations —173 162 119 454
Write down of goodwill and other intangible assets 363 — — — 363
At 31 December 2009 28,379 1,562 2,577 3,785 36,303
Net book value at 31 December 2009 14,264 991 1,562 1,030 17,847
335RBS Group 2010
Financial statements