RBS 2010 Annual Report Download - page 152
Download and view the complete annual report
Please find page 152 of the 2010 RBS annual report below. You can navigate through the pages in the report by either clicking on the pages listed below, or by using the keyword search tool below to find specific information within the annual report.-
 1
1 -
2
-
3
-
4
-
5
-
6
-
7
-
8
-
9
-
10
-
11
-
12
-
13
-
14
-
15
-
16
-
17
-
18
-
19
-
20
-
21
-
22
-
23
-
24
-
25
-
26
-
27
-
28
-
29
-
30
-
31
-
32
-
33
-
34
-
35
-
36
-
37
-
38
-
39
-
40
-
41
-
42
-
43
-
44
-
45
-
46
-
47
-
48
-
49
-
50
-
51
-
52
-
53
-
54
-
55
-
56
-
57
-
58
-
59
-
60
-
61
-
62
-
63
-
64
-
65
-
66
-
67
-
68
-
69
-
70
-
71
-
72
-
73
-
74
-
75
-
76
-
77
-
78
-
79
-
80
-
81
-
82
-
83
-
84
-
85
-
86
-
87
-
88
-
89
-
90
-
91
-
92
-
93
-
94
-
95
-
96
-
97
-
98
-
99
-
100
-
101
-
102
-
103
-
104
-
105
-
106
-
107
-
108
-
109
-
110
-
111
-
112
-
113
-
114
-
115
-
116
-
117
-
118
-
119
-
120
-
121
-
122
-
123
-
124
-
125
-
126
-
127
-
128
-
129
-
130
-
131
-
132
-
133
-
134
-
135
-
136
-
137
-
138
-
139
-
140
-
141
-
 142
142 -
 143
143 -
 144
144 -
 145
145 -
 146
146 -
 147
147 -
 148
148 -
 149
149 -
 150
150 -
 151
151 -
 152
152 -
 153
153 -
 154
154 -
 155
155 -
 156
156 -
 157
157 -
 158
158 -
 159
159 -
 160
160 -
 161
161 -
 162
162 -
163
-
164
-
165
-
166
-
167
-
168
-
169
-
170
-
171
-
172
-
173
-
174
-
175
-
176
-
177
-
178
-
179
-
180
-
181
-
182
-
183
-
184
-
185
-
186
-
187
-
188
-
189
-
190
-
191
-
192
-
193
-
194
-
195
-
196
-
197
-
198
-
199
-
200
-
201
-
202
-
203
-
204
-
205
-
206
-
207
-
208
-
209
-
210
-
211
-
212
-
213
-
214
-
215
-
216
-
217
-
218
-
219
-
220
-
221
-
222
-
223
-
224
-
225
-
226
-
227
-
228
-
229
-
230
-
231
-
232
-
233
-
234
-
235
-
236
-
237
-
238
-
239
-
240
-
241
-
242
-
243
-
244
-
245
-
246
-
247
-
248
-
249
-
250
-
251
-
252
-
253
-
254
-
255
-
256
-
257
-
258
-
259
-
260
-
261
-
262
-
263
-
264
-
265
-
266
-
267
-
268
-
269
-
270
-
271
-
272
-
273
-
274
-
275
-
276
-
277
-
278
-
279
-
280
-
281
-
282
-
283
-
284
-
285
-
286
-
287
-
288
-
289
-
290
-
291
-
292
-
293
-
294
-
295
-
296
-
297
-
298
-
299
-
300
-
301
-
302
-
303
-
304
-
305
-
306
-
307
-
308
-
309
-
310
-
311
-
312
-
313
-
314
-
315
-
316
-
317
-
318
-
319
-
320
-
321
-
322
-
323
-
324
-
325
-
326
-
327
-
328
-
329
-
330
-
331
-
332
-
333
-
334
-
335
-
336
-
337
-
338
-
339
-
340
-
341
-
342
-
343
-
344
-
345
-
346
-
347
-
348
-
349
-
350
-
351
-
352
-
353
-
354
-
355
-
356
-
357
-
358
-
359
-
360
-
361
-
362
-
363
-
364
-
365
-
366
-
367
-
368
-
369
-
370
-
371
-
372
-
373
-
374
-
375
-
376
-
377
-
378
-
379
-
380
-
381
-
382
-
383
-
384
-
385
-
386
-
387
-
388
-
389
-
390
-
391
-
392
-
393
-
394
-
395
-
396
-
397
-
398
-
399
-
400
-
401
-
402
-
403
-
404
-
405
-
406
-
407
-
408
-
409
-
410
-
411
-
412
-
413
-
414
-
415
-
416
-
417
-
418
-
419
-
420
-
421
-
422
-
423
-
424
-
425
-
426
-
427
-
428
-
429
-
430
-
431
-
432
-
433
-
434
-
435
-
436
-
437
-
438
-
439
-
440
-
441
-
442
-
443
-
444
-
445
 |
 |

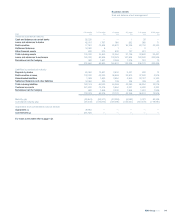
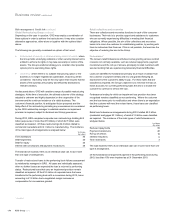
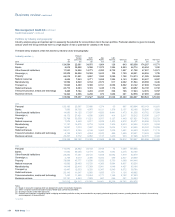
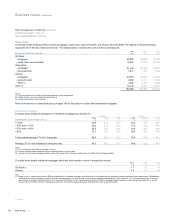
Risk management: Credit risk continued
Credit risk assets*
Credit risk assets consist of:
xLending: cash and balances at central banks and loans and
advances to banks and customers (including overdraft facilities,
instalment credit and finance leases);
xRate risk management (RRM); and
xContingent obligations, primarily letters of credit and guarantees.
Reverse repurchase agreements and issuer risk (primarily debt securities
-see page 176) are excluded. Where relevant, and unless otherwise
stated, the data reflects the effect of credit mitigation techniques.
Divisional analysis 2010
£m
2009
£m
UK Retail 108,302 103,029
UK Corporate 105,886 110,009
Wealth 18,875 16,553
Global Transaction Services 35,462 32,428
Ulster Bank 40,750 42,042
US Retail & Commercial 51,699 52,104
Retail & Commercial 360,974 356,165
Global Banking & Markets 171,891 205,588
Other 36,659 3,305
Core 569,524 565,058
Non-Core 125,383 158,499
694,907 723,557
Key points
xAll Core divisions either broadly maintained or reduced credit risk
assets over the period. The exception, ‘Other’, is driven by
exposures in Group Treasury. Growth here has occurred within the
highest asset quality bands reflecting exposure to central banks in
US, UK and Germany.
xNon-Core exposure reduced in line with targets during 2010 as a
result of disposals and active run-down of assets. Key reductions
include the country exits in Asia & Latin America, material reductions
in the Leveraged Finance business through asset sales and
restructurings and unwinding of trades within the Markets business.
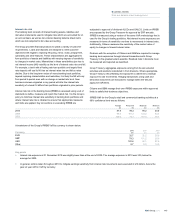
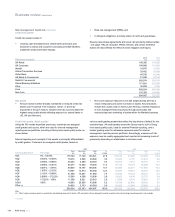
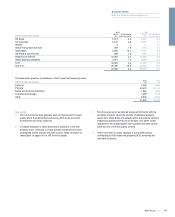
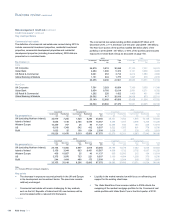
Credit risk assets: Asset quality*
Using the PD models described previously, customers are assigned
credit grades and scores, which are used for internal management
reporting across portfolios, including a Group level asset quality scale, as
shown below.
Internal reporting and oversight of risk assets is principally differentiated
by credit grades. Customers are assigned credit grades, based on
various credit grading models that reflect the key drivers of default for the
customer type. All credit grades across the Group map to both a Group
level asset quality scale, used for external financial reporting, and a
master grading scale for wholesale exposures used for internal
management reporting across portfolios. Accordingly, measures of risk
exposure may be readily aggregated and reported at increasing levels of
granularity depending on stakeholder or business need.
2010 2009
Asset quality band PD range Core
£m
Non-Core
£m
Total
£m
%
of total
Core
£m
Non-Core
£m
Total
£m
%
of total
AQ1 0% - 0.034% 175,793 17,728 193,521 27.8 149,132 23,226 172,358 23.8
AQ2 0.034% - 0.048%
18,274 2,526 20,800 3.0 18,029 3,187 21,216 2.9
AQ3 0.048% - 0.095%
26,244 4,259 30,503 4.4 26,703 7,613 34,316 4.7
AQ4 0.095% - 0.381%
64,277 15,052 79,329 11.4 78,144 18,154 96,298 13.3
AQ5 0.381% - 1.076%
90,639 18,767 109,406 15.7 92,908 24,977 117,885 16.3
AQ6 1.076% - 2.153%
73,367 12,913 86,280 12.4 76,206 18,072 94,278 13.0
AQ7 2.153% - 6.089%
41,399 10,451 51,850 7.5 44,643 15,732 60,375 8.3
AQ8 6.089% - 17.222%
15,300 4,308 19,608 2.8 18,923 4,834 23,757 3.4
AQ9 17.222% - 100%
11,398 8,621 20,019 2.9 11,589 8,074 19,663 2.7
AQ10 100% 18,003 25,005 43,008 6.2 16,756 22,666 39,422 5.5
Other (1) 34,830 5,753 40,583 5.9 32,025 11,964 43,989 6.1
569,524 125,383 694,907 100.0 565,058 158,499 723,557 100.0
Note:
(1) ‘Other’ largely comprises assets covered by the standardised approach for which a PD equivalent to those assigned to assets covered by the internal ratings based approach is not available.
*unaudited
RBS Group 2010150
Business review continued