RBS 2010 Annual Report Download - page 224
Download and view the complete annual report
Please find page 224 of the 2010 RBS annual report below. You can navigate through the pages in the report by either clicking on the pages listed below, or by using the keyword search tool below to find specific information within the annual report.-
 1
1 -
2
-
3
-
4
-
5
-
6
-
7
-
8
-
9
-
10
-
11
-
12
-
13
-
14
-
15
-
16
-
17
-
18
-
19
-
20
-
21
-
22
-
23
-
24
-
25
-
26
-
27
-
28
-
29
-
30
-
31
-
32
-
33
-
34
-
35
-
36
-
37
-
38
-
39
-
40
-
41
-
42
-
43
-
44
-
45
-
46
-
47
-
48
-
49
-
50
-
51
-
52
-
53
-
54
-
55
-
56
-
57
-
58
-
59
-
60
-
61
-
62
-
63
-
64
-
65
-
66
-
67
-
68
-
69
-
70
-
71
-
72
-
73
-
74
-
75
-
76
-
77
-
78
-
79
-
80
-
81
-
82
-
83
-
84
-
85
-
86
-
87
-
88
-
89
-
90
-
91
-
92
-
93
-
94
-
95
-
96
-
97
-
98
-
99
-
100
-
101
-
102
-
103
-
104
-
105
-
106
-
107
-
108
-
109
-
110
-
111
-
112
-
113
-
114
-
115
-
116
-
117
-
118
-
119
-
120
-
121
-
122
-
123
-
124
-
125
-
126
-
127
-
128
-
129
-
130
-
131
-
132
-
133
-
134
-
135
-
136
-
137
-
138
-
139
-
140
-
141
-
142
-
143
-
144
-
145
-
146
-
147
-
148
-
149
-
150
-
151
-
152
-
153
-
154
-
155
-
156
-
157
-
158
-
159
-
160
-
161
-
162
-
163
-
164
-
165
-
166
-
167
-
168
-
169
-
170
-
171
-
172
-
173
-
174
-
175
-
176
-
177
-
178
-
179
-
180
-
181
-
182
-
183
-
184
-
185
-
186
-
187
-
188
-
189
-
190
-
191
-
192
-
193
-
194
-
195
-
196
-
197
-
198
-
199
-
200
-
201
-
202
-
203
-
204
-
205
-
206
-
207
-
208
-
209
-
210
-
211
-
212
-
213
-
 214
214 -
 215
215 -
 216
216 -
 217
217 -
 218
218 -
 219
219 -
 220
220 -
 221
221 -
 222
222 -
 223
223 -
 224
224 -
 225
225 -
 226
226 -
 227
227 -
 228
228 -
 229
229 -
 230
230 -
 231
231 -
 232
232 -
 233
233 -
 234
234 -
235
-
236
-
237
-
238
-
239
-
240
-
241
-
242
-
243
-
244
-
245
-
246
-
247
-
248
-
249
-
250
-
251
-
252
-
253
-
254
-
255
-
256
-
257
-
258
-
259
-
260
-
261
-
262
-
263
-
264
-
265
-
266
-
267
-
268
-
269
-
270
-
271
-
272
-
273
-
274
-
275
-
276
-
277
-
278
-
279
-
280
-
281
-
282
-
283
-
284
-
285
-
286
-
287
-
288
-
289
-
290
-
291
-
292
-
293
-
294
-
295
-
296
-
297
-
298
-
299
-
300
-
301
-
302
-
303
-
304
-
305
-
306
-
307
-
308
-
309
-
310
-
311
-
312
-
313
-
314
-
315
-
316
-
317
-
318
-
319
-
320
-
321
-
322
-
323
-
324
-
325
-
326
-
327
-
328
-
329
-
330
-
331
-
332
-
333
-
334
-
335
-
336
-
337
-
338
-
339
-
340
-
341
-
342
-
343
-
344
-
345
-
346
-
347
-
348
-
349
-
350
-
351
-
352
-
353
-
354
-
355
-
356
-
357
-
358
-
359
-
360
-
361
-
362
-
363
-
364
-
365
-
366
-
367
-
368
-
369
-
370
-
371
-
372
-
373
-
374
-
375
-
376
-
377
-
378
-
379
-
380
-
381
-
382
-
383
-
384
-
385
-
386
-
387
-
388
-
389
-
390
-
391
-
392
-
393
-
394
-
395
-
396
-
397
-
398
-
399
-
400
-
401
-
402
-
403
-
404
-
405
-
406
-
407
-
408
-
409
-
410
-
411
-
412
-
413
-
414
-
415
-
416
-
417
-
418
-
419
-
420
-
421
-
422
-
423
-
424
-
425
-
426
-
427
-
428
-
429
-
430
-
431
-
432
-
433
-
434
-
435
-
436
-
437
-
438
-
439
-
440
-
441
-
442
-
443
-
444
-
445
 |
 |

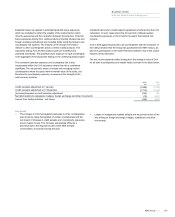
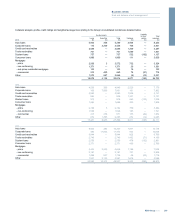
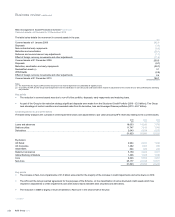
Risk management: Asset Protection Scheme* continued
Covered assets: roll forward to 31 December 2010
The table below details the movement in covered assets in the year.
£bn
Covered assets at 1 January 2009 282.0
Disposals (3.0)
Non-contractual early repayments (8.9)
Maturities and amortisation (26.1)
Rollovers and covered amount cap adjustments (1.7)
Effect of foreign currency movements and other adjustments (11.8)
Covered assets at 31 December 2009 230.5
Disposals (9.7)
Maturities, amortisation and early repayments (28.7)
Reclassified assets (2) 3.1
Withdrawals (2.9)
Effect of foreign currency movements and other adjustments 2.4
Covered assets at 31 December 2010 194.7
Notes:
(1) The Asset Protection Agency (APA) and the Group have now reached agreement on substantially all eligibility issues.
(2) In Q2 2010, the APA and the Group reached agreement over the classification of some structured credit assets which resulted in adjustments to the covered amount, without affecting the underlying
risk protection.
Key points
xThe reduction in covered assets was due to run-off of the portfolio, disposals, early repayments and maturing loans.
xAs part of the Group’s risk reduction strategy significant disposals were made from the Structured Credit Portfolio (2010 - £3.0 billion). The Group
took advantage of market conditions and executed sales from its derivative, loan and leveraged finance portfolios (2010 - £6.7 billion).
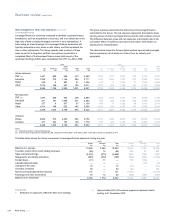
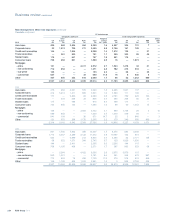
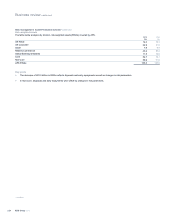
Credit impairments and write downs
The table below analyses the cumulative credit impairment losses and adjustments to par value (including AFS reserves) relating to the covered assets.
2010 2009 2008
£m £m £m
Loans and advances 18,033 14,240 7,705
Debt securities 11,747 7,816 7,942
Derivatives 2,043 6,834 6,575
31,823 28,890 22,222
By division:
UK Retail 2,964 2,431 1,492
UK Corporate 1,382 1,007 285
Ulster Bank 804 486 234
Retail & Commercial 5,150 3,924 2,011
Global Banking & Markets 1,496 1,628 1,640
Core 6,646 5,552 3,651
Non-Core 25,177 23,338 18,571
31,823 28,890 22,222
Key points
xThe increase in Non-Core impairments of £1.8 billion accounted for the majority of the increase in credit impairments and write downs in 2010.
xThe APA and the Group reached agreement for the purposes of the Scheme, on the classification of some structured credit assets which has
resulted in adjustments to credit impairments and write downs mainly between debt securities and derivatives.
xThe reduction in GBM is largely a result of transfers to Non-Core in the second half of the year.
*unaudited
RBS Group 2010222
Business review continued