RBS 2010 Annual Report Download - page 318
Download and view the complete annual report
Please find page 318 of the 2010 RBS annual report below. You can navigate through the pages in the report by either clicking on the pages listed below, or by using the keyword search tool below to find specific information within the annual report.-
 1
1 -
2
-
3
-
4
-
5
-
6
-
7
-
8
-
9
-
10
-
11
-
12
-
13
-
14
-
15
-
16
-
17
-
18
-
19
-
20
-
21
-
22
-
23
-
24
-
25
-
26
-
27
-
28
-
29
-
30
-
31
-
32
-
33
-
34
-
35
-
36
-
37
-
38
-
39
-
40
-
41
-
42
-
43
-
44
-
45
-
46
-
47
-
48
-
49
-
50
-
51
-
52
-
53
-
54
-
55
-
56
-
57
-
58
-
59
-
60
-
61
-
62
-
63
-
64
-
65
-
66
-
67
-
68
-
69
-
70
-
71
-
72
-
73
-
74
-
75
-
76
-
77
-
78
-
79
-
80
-
81
-
82
-
83
-
84
-
85
-
86
-
87
-
88
-
89
-
90
-
91
-
92
-
93
-
94
-
95
-
96
-
97
-
98
-
99
-
100
-
101
-
102
-
103
-
104
-
105
-
106
-
107
-
108
-
109
-
110
-
111
-
112
-
113
-
114
-
115
-
116
-
117
-
118
-
119
-
120
-
121
-
122
-
123
-
124
-
125
-
126
-
127
-
128
-
129
-
130
-
131
-
132
-
133
-
134
-
135
-
136
-
137
-
138
-
139
-
140
-
141
-
142
-
143
-
144
-
145
-
146
-
147
-
148
-
149
-
150
-
151
-
152
-
153
-
154
-
155
-
156
-
157
-
158
-
159
-
160
-
161
-
162
-
163
-
164
-
165
-
166
-
167
-
168
-
169
-
170
-
171
-
172
-
173
-
174
-
175
-
176
-
177
-
178
-
179
-
180
-
181
-
182
-
183
-
184
-
185
-
186
-
187
-
188
-
189
-
190
-
191
-
192
-
193
-
194
-
195
-
196
-
197
-
198
-
199
-
200
-
201
-
202
-
203
-
204
-
205
-
206
-
207
-
208
-
209
-
210
-
211
-
212
-
213
-
214
-
215
-
216
-
217
-
218
-
219
-
220
-
221
-
222
-
223
-
224
-
225
-
226
-
227
-
228
-
229
-
230
-
231
-
232
-
233
-
234
-
235
-
236
-
237
-
238
-
239
-
240
-
241
-
242
-
243
-
244
-
245
-
246
-
247
-
248
-
249
-
250
-
251
-
252
-
253
-
254
-
255
-
256
-
257
-
258
-
259
-
260
-
261
-
262
-
263
-
264
-
265
-
266
-
267
-
268
-
269
-
270
-
271
-
272
-
273
-
274
-
275
-
276
-
277
-
278
-
279
-
280
-
281
-
282
-
283
-
284
-
285
-
286
-
287
-
288
-
289
-
290
-
291
-
292
-
293
-
294
-
295
-
296
-
297
-
298
-
299
-
300
-
301
-
302
-
303
-
304
-
305
-
306
-
307
-
 308
308 -
 309
309 -
 310
310 -
 311
311 -
 312
312 -
 313
313 -
 314
314 -
 315
315 -
 316
316 -
 317
317 -
 318
318 -
 319
319 -
 320
320 -
 321
321 -
 322
322 -
 323
323 -
 324
324 -
 325
325 -
 326
326 -
 327
327 -
 328
328 -
329
-
330
-
331
-
332
-
333
-
334
-
335
-
336
-
337
-
338
-
339
-
340
-
341
-
342
-
343
-
344
-
345
-
346
-
347
-
348
-
349
-
350
-
351
-
352
-
353
-
354
-
355
-
356
-
357
-
358
-
359
-
360
-
361
-
362
-
363
-
364
-
365
-
366
-
367
-
368
-
369
-
370
-
371
-
372
-
373
-
374
-
375
-
376
-
377
-
378
-
379
-
380
-
381
-
382
-
383
-
384
-
385
-
386
-
387
-
388
-
389
-
390
-
391
-
392
-
393
-
394
-
395
-
396
-
397
-
398
-
399
-
400
-
401
-
402
-
403
-
404
-
405
-
406
-
407
-
408
-
409
-
410
-
411
-
412
-
413
-
414
-
415
-
416
-
417
-
418
-
419
-
420
-
421
-
422
-
423
-
424
-
425
-
426
-
427
-
428
-
429
-
430
-
431
-
432
-
433
-
434
-
435
-
436
-
437
-
438
-
439
-
440
-
441
-
442
-
443
-
444
-
445
 |
 |

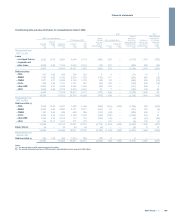
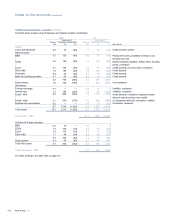
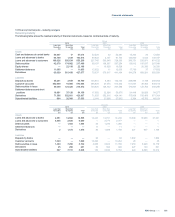
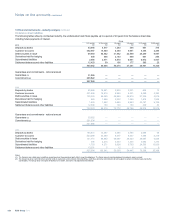
12 Financial instruments - valuation continued
The table below analyses level 3 balances and related valuation sensitivities.
2010 2009
Sensitivity (2)
Sensitivity (2)
Balance Favourable Unfavourable Balance Favourable Unfavourable
£bn £m £m £bn £m £m
Assumptions
Assets
Loans and advances 0.8 70 (60) 1.1 80 (40) Credit spreads, indices
Debt securities
MBS 0.7 120 (80) 0.6 60 (10) Prepayment rates, probability of default, loss
severity and yield
CDOs 2.4 180 (20) 1.0 130 (80) Implied collateral valuation, default rates, housing
prices, correlation
CLOs 2.1 180 (50) 0.8 80 (50) Credit spreads, recovery rates, correlation
Other ABS 1.4 150 (80) 0.9 120 (40) Credit spreads
Corporate 0.9 60 (60) 0.6 70 (20) Credit spreads
Bank and building societies 0.7 60 (60) 0.2 10 (30) Credit spreads
8.2 750 (350) 4.1 470 (230)
Equity shares 1.0 160 (160) 1.5 280 (220) Fund valuation
Derivatives
Foreign exchange 0.1 — — 0.2 10 —
Volatility, correlation
Interest rate 1.7 150 (140) 1.5 80 (100) Volatility, correlation
Credit - APS 0.6 860 (940) 1.4 1,370 (1,540) Credit spreads, correlation, expected losses,
discount rate recoveries, loss credits
Credit - other 3.1 320 (170) 3.0 420 (360) Counterparty credit risk, correlation, volatility
Equities and commodities 0.2 — — 0.3 20 (20) Correlation, dividends
5.7 1,330 (1,250) 6.4 1,900 (2,020)
Total assets 15.7 2,310 (1,820) 13.1 2,730 (2,510)
Total assets - 2008 21.4 1,880 (2,200)
Of which AFS debt securities:
MBS 0.4 10 — 0.2 — —
CDOs 1.4 100 (10) 0.4 40 (20)
CLOs 1.5 110 (10) 0.1 10 (10)
Other ABS 1.1 80 (40) 0.6 40 (20)
4.4 300 (60) 1.3 90 (50)
Equity shares 0.3 60 (60) 0.7 100 (90)
Total AFS assets 4.7 360 (120) 2.0 190 (140)
Total AFS assets - 2008 3.3 150 (230)
For notes relating to this table refer to page 317.
RBS Group 2010316
Notes on the accounts continued