RBS 2010 Annual Report Download - page 273
Download and view the complete annual report
Please find page 273 of the 2010 RBS annual report below. You can navigate through the pages in the report by either clicking on the pages listed below, or by using the keyword search tool below to find specific information within the annual report.-
 1
1 -
2
-
3
-
4
-
5
-
6
-
7
-
8
-
9
-
10
-
11
-
12
-
13
-
14
-
15
-
16
-
17
-
18
-
19
-
20
-
21
-
22
-
23
-
24
-
25
-
26
-
27
-
28
-
29
-
30
-
31
-
32
-
33
-
34
-
35
-
36
-
37
-
38
-
39
-
40
-
41
-
42
-
43
-
44
-
45
-
46
-
47
-
48
-
49
-
50
-
51
-
52
-
53
-
54
-
55
-
56
-
57
-
58
-
59
-
60
-
61
-
62
-
63
-
64
-
65
-
66
-
67
-
68
-
69
-
70
-
71
-
72
-
73
-
74
-
75
-
76
-
77
-
78
-
79
-
80
-
81
-
82
-
83
-
84
-
85
-
86
-
87
-
88
-
89
-
90
-
91
-
92
-
93
-
94
-
95
-
96
-
97
-
98
-
99
-
100
-
101
-
102
-
103
-
104
-
105
-
106
-
107
-
108
-
109
-
110
-
111
-
112
-
113
-
114
-
115
-
116
-
117
-
118
-
119
-
120
-
121
-
122
-
123
-
124
-
125
-
126
-
127
-
128
-
129
-
130
-
131
-
132
-
133
-
134
-
135
-
136
-
137
-
138
-
139
-
140
-
141
-
142
-
143
-
144
-
145
-
146
-
147
-
148
-
149
-
150
-
151
-
152
-
153
-
154
-
155
-
156
-
157
-
158
-
159
-
160
-
161
-
162
-
163
-
164
-
165
-
166
-
167
-
168
-
169
-
170
-
171
-
172
-
173
-
174
-
175
-
176
-
177
-
178
-
179
-
180
-
181
-
182
-
183
-
184
-
185
-
186
-
187
-
188
-
189
-
190
-
191
-
192
-
193
-
194
-
195
-
196
-
197
-
198
-
199
-
200
-
201
-
202
-
203
-
204
-
205
-
206
-
207
-
208
-
209
-
210
-
211
-
212
-
213
-
214
-
215
-
216
-
217
-
218
-
219
-
220
-
221
-
222
-
223
-
224
-
225
-
226
-
227
-
228
-
229
-
230
-
231
-
232
-
233
-
234
-
235
-
236
-
237
-
238
-
239
-
240
-
241
-
242
-
243
-
244
-
245
-
246
-
247
-
248
-
249
-
250
-
251
-
252
-
253
-
254
-
255
-
256
-
257
-
258
-
259
-
260
-
261
-
262
-
 263
263 -
 264
264 -
 265
265 -
 266
266 -
 267
267 -
 268
268 -
 269
269 -
 270
270 -
 271
271 -
 272
272 -
 273
273 -
 274
274 -
 275
275 -
 276
276 -
 277
277 -
 278
278 -
 279
279 -
 280
280 -
 281
281 -
 282
282 -
 283
283 -
284
-
285
-
286
-
287
-
288
-
289
-
290
-
291
-
292
-
293
-
294
-
295
-
296
-
297
-
298
-
299
-
300
-
301
-
302
-
303
-
304
-
305
-
306
-
307
-
308
-
309
-
310
-
311
-
312
-
313
-
314
-
315
-
316
-
317
-
318
-
319
-
320
-
321
-
322
-
323
-
324
-
325
-
326
-
327
-
328
-
329
-
330
-
331
-
332
-
333
-
334
-
335
-
336
-
337
-
338
-
339
-
340
-
341
-
342
-
343
-
344
-
345
-
346
-
347
-
348
-
349
-
350
-
351
-
352
-
353
-
354
-
355
-
356
-
357
-
358
-
359
-
360
-
361
-
362
-
363
-
364
-
365
-
366
-
367
-
368
-
369
-
370
-
371
-
372
-
373
-
374
-
375
-
376
-
377
-
378
-
379
-
380
-
381
-
382
-
383
-
384
-
385
-
386
-
387
-
388
-
389
-
390
-
391
-
392
-
393
-
394
-
395
-
396
-
397
-
398
-
399
-
400
-
401
-
402
-
403
-
404
-
405
-
406
-
407
-
408
-
409
-
410
-
411
-
412
-
413
-
414
-
415
-
416
-
417
-
418
-
419
-
420
-
421
-
422
-
423
-
424
-
425
-
426
-
427
-
428
-
429
-
430
-
431
-
432
-
433
-
434
-
435
-
436
-
437
-
438
-
439
-
440
-
441
-
442
-
443
-
444
-
445
 |
 |

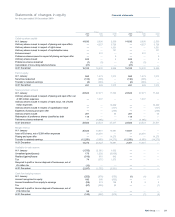
Group Company
2010 2009 2008 2010 2009 2008
£m £m £m £m £m £m
Called-up share capital
At 1 January 14,630 9,898 2,530 14,630 9,898 2,530
Ordinary shares issued in respect of placing and open offers —4,227 5,728 —4,227 5,728
Ordinary shares issued in respect of rights issue —— 1,531 —— 1,531
Ordinary shares issued in respect of capitalisation issue —— 101 —— 101
Bshares issued —510 — —510 —
Preference shares issued in respect of placing and open offer —— 5 ——5
Ordinary shares issued 523 — 3 523 —3
Preference shares redeemed (1) (5) — (1) (5) —
Cancellation of non-voting deferred shares (27) — — (27) ——
At 31 December 15,125 14,630 9,898 15,125 14,630 9,898
Paid-in equity
At 1 January 565 1,073 1,073 565 1,073 1,073
Securities redeemed (132) (308) — (132) (308) —
Transfer to retained earnings (2) (200) — (2) (200) —
At 31 December 431 565 1,073 431 565 1,073
Share premium account
At 1 January 23,523 27,471 17,322 23,523 27,471 17,322
Ordinary shares issued in respect of placing and open offer, net
of £95 million expenses —1,047 — —1,047 —
Ordinary shares issued in respect of rights issue, net of £246
million expenses —— 10,469 —— 10,469
Ordinary shares issued in respect of capitalisation issue —— (101) —— (101)
Expenses of placing and open offer —— (265) —— (265)
Ordinary shares issued 281 — 46 281 — 46
Redemption of preference shares classified as debt 118 — — 118 ——
Preference shares redeemed —(4,995) — —(4,995) —
At 31 December 23,922 23,523 27,471 23,922 23,523 27,471
Merger reserve
At 1 January 25,522 10,881 10,881 14,641 ——
Issue of B shares, net of £399 million expenses —24,591 — —24,591 —
Placing and open offer —— 14,273 —— 14,273
Transfer to retained earnings (12,250) (9,950) (14,273) (12,250) (9,950) (14,273)
At 31 December 13,272 25,522 10,881 2,391 14,641 —
Available-for-sale reserve
At 1 January (1,755) (3,561) 1,032 ———
Unrealised gains/(losses) 179 1,202 (6,808) ———
Realised (gains)/losses (519) 981 842 ———
Tax 74 (377) 1,373 ———
Recycled to profit or loss on disposal of businesses, net of
£5 million tax (16) — — ———
At 31 December (2,037) (1,755) (3,561) ———
Cash flow hedging reserve
At 1 January (252) (876) (555) (1) (4) (5)
Amount recognised in equity 180 380 (603) ———
Amount transferred from equity to earnings (59) 513 198 132
Tax (67) (269) 84 ——(1)
Recycled to profit or loss on disposal of businesses, net of
£19 million tax 58 — — ———
At 31 December (140) (252) (876) —(1) (4)
271RBS Group 2010
Financial statements
Statements of changes in equity
for the year ended 31 December 2010