RBS 2010 Annual Report Download - page 96
Download and view the complete annual report
Please find page 96 of the 2010 RBS annual report below. You can navigate through the pages in the report by either clicking on the pages listed below, or by using the keyword search tool below to find specific information within the annual report.-
 1
1 -
2
-
3
-
4
-
5
-
6
-
7
-
8
-
9
-
10
-
11
-
12
-
13
-
14
-
15
-
16
-
17
-
18
-
19
-
20
-
21
-
22
-
23
-
24
-
25
-
26
-
27
-
28
-
29
-
30
-
31
-
32
-
33
-
34
-
35
-
36
-
37
-
38
-
39
-
40
-
41
-
42
-
43
-
44
-
45
-
46
-
47
-
48
-
49
-
50
-
51
-
52
-
53
-
54
-
55
-
56
-
57
-
58
-
59
-
60
-
61
-
62
-
63
-
64
-
65
-
66
-
67
-
68
-
69
-
70
-
71
-
72
-
73
-
74
-
75
-
76
-
77
-
78
-
79
-
80
-
81
-
82
-
83
-
84
-
85
-
 86
86 -
 87
87 -
 88
88 -
 89
89 -
 90
90 -
 91
91 -
 92
92 -
 93
93 -
 94
94 -
 95
95 -
 96
96 -
 97
97 -
 98
98 -
 99
99 -
 100
100 -
 101
101 -
 102
102 -
 103
103 -
 104
104 -
 105
105 -
 106
106 -
107
-
108
-
109
-
110
-
111
-
112
-
113
-
114
-
115
-
116
-
117
-
118
-
119
-
120
-
121
-
122
-
123
-
124
-
125
-
126
-
127
-
128
-
129
-
130
-
131
-
132
-
133
-
134
-
135
-
136
-
137
-
138
-
139
-
140
-
141
-
142
-
143
-
144
-
145
-
146
-
147
-
148
-
149
-
150
-
151
-
152
-
153
-
154
-
155
-
156
-
157
-
158
-
159
-
160
-
161
-
162
-
163
-
164
-
165
-
166
-
167
-
168
-
169
-
170
-
171
-
172
-
173
-
174
-
175
-
176
-
177
-
178
-
179
-
180
-
181
-
182
-
183
-
184
-
185
-
186
-
187
-
188
-
189
-
190
-
191
-
192
-
193
-
194
-
195
-
196
-
197
-
198
-
199
-
200
-
201
-
202
-
203
-
204
-
205
-
206
-
207
-
208
-
209
-
210
-
211
-
212
-
213
-
214
-
215
-
216
-
217
-
218
-
219
-
220
-
221
-
222
-
223
-
224
-
225
-
226
-
227
-
228
-
229
-
230
-
231
-
232
-
233
-
234
-
235
-
236
-
237
-
238
-
239
-
240
-
241
-
242
-
243
-
244
-
245
-
246
-
247
-
248
-
249
-
250
-
251
-
252
-
253
-
254
-
255
-
256
-
257
-
258
-
259
-
260
-
261
-
262
-
263
-
264
-
265
-
266
-
267
-
268
-
269
-
270
-
271
-
272
-
273
-
274
-
275
-
276
-
277
-
278
-
279
-
280
-
281
-
282
-
283
-
284
-
285
-
286
-
287
-
288
-
289
-
290
-
291
-
292
-
293
-
294
-
295
-
296
-
297
-
298
-
299
-
300
-
301
-
302
-
303
-
304
-
305
-
306
-
307
-
308
-
309
-
310
-
311
-
312
-
313
-
314
-
315
-
316
-
317
-
318
-
319
-
320
-
321
-
322
-
323
-
324
-
325
-
326
-
327
-
328
-
329
-
330
-
331
-
332
-
333
-
334
-
335
-
336
-
337
-
338
-
339
-
340
-
341
-
342
-
343
-
344
-
345
-
346
-
347
-
348
-
349
-
350
-
351
-
352
-
353
-
354
-
355
-
356
-
357
-
358
-
359
-
360
-
361
-
362
-
363
-
364
-
365
-
366
-
367
-
368
-
369
-
370
-
371
-
372
-
373
-
374
-
375
-
376
-
377
-
378
-
379
-
380
-
381
-
382
-
383
-
384
-
385
-
386
-
387
-
388
-
389
-
390
-
391
-
392
-
393
-
394
-
395
-
396
-
397
-
398
-
399
-
400
-
401
-
402
-
403
-
404
-
405
-
406
-
407
-
408
-
409
-
410
-
411
-
412
-
413
-
414
-
415
-
416
-
417
-
418
-
419
-
420
-
421
-
422
-
423
-
424
-
425
-
426
-
427
-
428
-
429
-
430
-
431
-
432
-
433
-
434
-
435
-
436
-
437
-
438
-
439
-
440
-
441
-
442
-
443
-
444
-
445
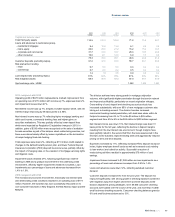
 |
 |

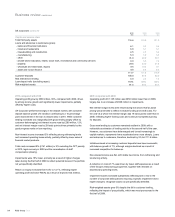
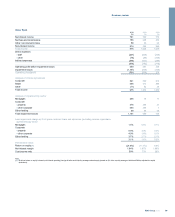
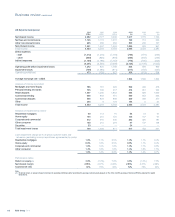
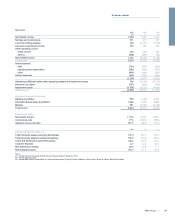
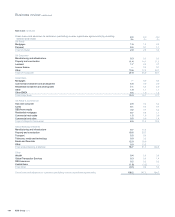
Global Banking & Markets
2010 2009 2008
£m £m £m
Net interest income from banking activities 1,276 2,243 2,440
Net fees and commissions receivable 1,495 1,335 1,223
Income from trading activities 4,982 7,812 (1,100)
Other operating income (net of related funding costs) 159 (332) (206)
Non-interest income 6,636 8,815 (83)
Total income 7,912 11,058 2,357
Direct expenses
- staff (2,693) (2,904) (2,034)
- other (842) (777) (1,017)
Indirect expenses (862) (979) (937)
(4,397) (4,660) (3,988)
Operating profit/(loss) before impairment losses and fair value of own debt 3,515 6,398 (1,631)
Impairment losses (151) (640) (522)
Operating profit/(loss) before fair value of own debt 3,364 5,758 (2,153)
Fair value of own debt 139 (49) 357
Operating profit/(loss) 3,503 5,709 (1,796)
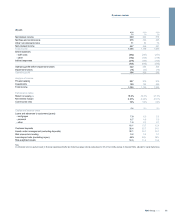
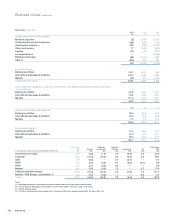
Analysis of income by product
Rates - money markets 65 1,714 1,641
Rates - flow 1,985 3,142 1,386
Currencies & commodities 870 1,277 1,539
Credit and mortgage markets 2,215 2,255 (3,435)
Portfolio management and origination 1,844 1,196 858
Equities 933 1,474 368
Total income 7,912 11,058 2,357
Analysis of impairment by sector
Manufacturing and infrastructure (51) 91 39
Property and construction 74 49 12
Banks and financial institutions 177 348 186
Other (49) 152 285
Total impairment losses 151 640 522
Loan impairment charge as % of gross customer loans and advances (excluding reverse repurchase
agreements) 0.2% 0.6% 0.3%
Performance ratios
Return on equity (1) 16.6% 29.8% (9.1%)
Net interest margin 1.05% 1.38% 1.34%
Cost:income ratio 56% 42% 169%
Compensation ratio (2) 34% 26% 86%
Notes:
(1) Divisional return on equity is based on divisional operating profit/(loss) after tax divided by average notional equity (based on 10% of the monthly average of divisional RWAs, adjusted for capital
deductions).
(2) Compensation ratio is based on staff costs as a percentage of total income, excluding the fair value of own debt.
RBS Group 201094
Business review continued