RBS 2010 Annual Report Download - page 219
Download and view the complete annual report
Please find page 219 of the 2010 RBS annual report below. You can navigate through the pages in the report by either clicking on the pages listed below, or by using the keyword search tool below to find specific information within the annual report.-
 1
1 -
2
-
3
-
4
-
5
-
6
-
7
-
8
-
9
-
10
-
11
-
12
-
13
-
14
-
15
-
16
-
17
-
18
-
19
-
20
-
21
-
22
-
23
-
24
-
25
-
26
-
27
-
28
-
29
-
30
-
31
-
32
-
33
-
34
-
35
-
36
-
37
-
38
-
39
-
40
-
41
-
42
-
43
-
44
-
45
-
46
-
47
-
48
-
49
-
50
-
51
-
52
-
53
-
54
-
55
-
56
-
57
-
58
-
59
-
60
-
61
-
62
-
63
-
64
-
65
-
66
-
67
-
68
-
69
-
70
-
71
-
72
-
73
-
74
-
75
-
76
-
77
-
78
-
79
-
80
-
81
-
82
-
83
-
84
-
85
-
86
-
87
-
88
-
89
-
90
-
91
-
92
-
93
-
94
-
95
-
96
-
97
-
98
-
99
-
100
-
101
-
102
-
103
-
104
-
105
-
106
-
107
-
108
-
109
-
110
-
111
-
112
-
113
-
114
-
115
-
116
-
117
-
118
-
119
-
120
-
121
-
122
-
123
-
124
-
125
-
126
-
127
-
128
-
129
-
130
-
131
-
132
-
133
-
134
-
135
-
136
-
137
-
138
-
139
-
140
-
141
-
142
-
143
-
144
-
145
-
146
-
147
-
148
-
149
-
150
-
151
-
152
-
153
-
154
-
155
-
156
-
157
-
158
-
159
-
160
-
161
-
162
-
163
-
164
-
165
-
166
-
167
-
168
-
169
-
170
-
171
-
172
-
173
-
174
-
175
-
176
-
177
-
178
-
179
-
180
-
181
-
182
-
183
-
184
-
185
-
186
-
187
-
188
-
189
-
190
-
191
-
192
-
193
-
194
-
195
-
196
-
197
-
198
-
199
-
200
-
201
-
202
-
203
-
204
-
205
-
206
-
207
-
208
-
 209
209 -
 210
210 -
 211
211 -
 212
212 -
 213
213 -
 214
214 -
 215
215 -
 216
216 -
 217
217 -
 218
218 -
 219
219 -
 220
220 -
 221
221 -
 222
222 -
 223
223 -
 224
224 -
 225
225 -
 226
226 -
 227
227 -
 228
228 -
 229
229 -
230
-
231
-
232
-
233
-
234
-
235
-
236
-
237
-
238
-
239
-
240
-
241
-
242
-
243
-
244
-
245
-
246
-
247
-
248
-
249
-
250
-
251
-
252
-
253
-
254
-
255
-
256
-
257
-
258
-
259
-
260
-
261
-
262
-
263
-
264
-
265
-
266
-
267
-
268
-
269
-
270
-
271
-
272
-
273
-
274
-
275
-
276
-
277
-
278
-
279
-
280
-
281
-
282
-
283
-
284
-
285
-
286
-
287
-
288
-
289
-
290
-
291
-
292
-
293
-
294
-
295
-
296
-
297
-
298
-
299
-
300
-
301
-
302
-
303
-
304
-
305
-
306
-
307
-
308
-
309
-
310
-
311
-
312
-
313
-
314
-
315
-
316
-
317
-
318
-
319
-
320
-
321
-
322
-
323
-
324
-
325
-
326
-
327
-
328
-
329
-
330
-
331
-
332
-
333
-
334
-
335
-
336
-
337
-
338
-
339
-
340
-
341
-
342
-
343
-
344
-
345
-
346
-
347
-
348
-
349
-
350
-
351
-
352
-
353
-
354
-
355
-
356
-
357
-
358
-
359
-
360
-
361
-
362
-
363
-
364
-
365
-
366
-
367
-
368
-
369
-
370
-
371
-
372
-
373
-
374
-
375
-
376
-
377
-
378
-
379
-
380
-
381
-
382
-
383
-
384
-
385
-
386
-
387
-
388
-
389
-
390
-
391
-
392
-
393
-
394
-
395
-
396
-
397
-
398
-
399
-
400
-
401
-
402
-
403
-
404
-
405
-
406
-
407
-
408
-
409
-
410
-
411
-
412
-
413
-
414
-
415
-
416
-
417
-
418
-
419
-
420
-
421
-
422
-
423
-
424
-
425
-
426
-
427
-
428
-
429
-
430
-
431
-
432
-
433
-
434
-
435
-
436
-
437
-
438
-
439
-
440
-
441
-
442
-
443
-
444
-
445
 |
 |

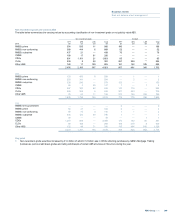
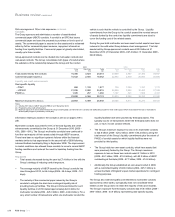
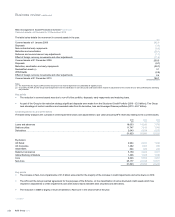
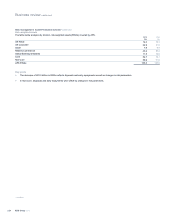
In addition to the above, UK Corporate and Ulster Bank have leveraged finance exposures as set out below.
2010 2009 2008
£m £m £m
UK Corporate
- debt financing (1) 3,664 4,041 4,496
- senior debt transactions (2) 2,604 3,034 2,330
Total UK Corporate 6,268 7,075 6,826
Ulster Bank 597 621 694
6,865 7,696 7,520
Notes:
(1) Loans for UK mid-market buyouts, supplementing equity capital provided by third party private equity investors.
(2) Loans to UK mid-corporates supporting acquisitions, recapitalisations or general corporate purposes where higher leverage criteria were met.
Special purpose entities
The Group arranges securitisations to facilitate client transactions and
undertakes securitisations to sell financial assets or to fund specific
portfolios of assets. The Group also acts as an underwriter and depositor
in securitisation transactions involving both client and proprietary
transactions. In a securitisation, assets, or interests in a pool of assets,
are transferred generally to a special purpose entity (SPE) which then
issues liabilities to third party investors. SPEs are vehicles established for
aspecific, limited purpose, usually do not carry out a business or trade
and typically have no employees. They take a variety of legal forms -
trusts, partnerships and companies - and fulfil many different functions.
As well as being a key element of securitisations, SPEs are also used in
fund management activities to segregate custodial duties from the fund
management advice provided by the Group.
It is primarily the extent of risks and rewards assumed that determines
whether these entities are consolidated in the Group's financial
statements. The following section aims to address the significant
exposures which arise from the Group's activities through specific types
of SPEs.
The Group sponsors and arranges own-asset securitisations, whereby
the sale of assets or interests in a pool of assets into an SPE is financed
by the issuance of securities to investors. The pool of assets held by the
SPE may be originated by the Group, or (in the case of whole loan
programmes) purchased from third parties, and may be of varying credit
quality. Investors in the debt securities issued by the SPE are rewarded
through credit-linked returns, according to the credit rating of their
securities. The majority of securitisations are supported through liquidity
facilities, other credit enhancements and derivative hedges extended by
financial institutions, some of which offer protection against initial defaults
in the pool of assets. Thereafter, losses are absorbed by investors in the
lowest ranking notes in the priority of payments. Investors in the most
senior ranking debt securities are typically shielded from loss, since any
subsequent losses may trigger repayment of their initial principal.
The Group also employs synthetic structures, where assets are not sold
to the SPE, but credit derivatives are used to transfer the credit risk of the
assets to an SPE. Securities may then be issued by the SPE to investors,
on the back of the credit protection sold to the Group by the SPE.
Residential and commercial mortgages and credit card receivables form
the types of assets generally included in cash securitisations, while
corporate loans and commercial mortgages typically serve as reference
obligations in synthetic securitisations.
The Group sponsors own-asset securitisations primarily as a way of
diversifying funding sources. The Group purchases the securities issued
in own asset securitisations. During 2008, the Group was able to pledge
AAA rated asset-backed securities as collateral for repurchase
agreements with major central banks under schemes such as the Bank of
England's Special Liquidity Scheme, launched in April 2008, which
allowed banks to temporarily swap high-quality mortgage-backed and
other securities for liquid UK treasury bills. This practice contributed to
the Group's sources of funding in the face of the contraction in the UK
market for inter-bank lending, particularly during 2008 and 2009, and
investor base for securitisations.
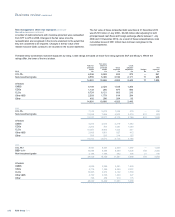
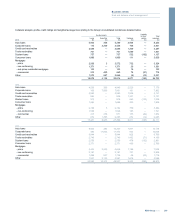
The table below sets out the asset categories, together with the carrying
value of the assets and associated liabilities for those securitisations and
other asset transfers, other than conduits (discussed below), where the
assets continue to be recorded on the Group's balance sheet
2010 2009 2008
Assets Liabilities Assets Liabilities Assets Liabilities
£m £m £m £m £m £m
Residential mortgages 76,212 18,215
69,927 15,937 55,714 20,075
Credit card receivables 3,993 34
2,975 1,592 3,004 3,197
Other loans 30,988 974
36,448 1,010 1,679 1,071
Finance lease receivables 510 510
597 597 1,077 857
Assets are significantly greater than liabilities, as all notes issued by funding related own asset securitisation SPEs are purchased by Group companies.
217RBS Group 2010
Business review
Risk and balance sheet management