RBS 2010 Annual Report Download - page 15
Download and view the complete annual report
Please find page 15 of the 2010 RBS annual report below. You can navigate through the pages in the report by either clicking on the pages listed below, or by using the keyword search tool below to find specific information within the annual report.-
 1
1 -
2
-
3
-
4
-
 5
5 -
 6
6 -
 7
7 -
 8
8 -
 9
9 -
 10
10 -
 11
11 -
 12
12 -
 13
13 -
 14
14 -
 15
15 -
 16
16 -
 17
17 -
 18
18 -
 19
19 -
 20
20 -
 21
21 -
 22
22 -
 23
23 -
 24
24 -
 25
25 -
26
-
27
-
28
-
29
-
30
-
31
-
32
-
33
-
34
-
35
-
36
-
37
-
38
-
39
-
40
-
41
-
42
-
43
-
44
-
45
-
46
-
47
-
48
-
49
-
50
-
51
-
52
-
53
-
54
-
55
-
56
-
57
-
58
-
59
-
60
-
61
-
62
-
63
-
64
-
65
-
66
-
67
-
68
-
69
-
70
-
71
-
72
-
73
-
74
-
75
-
76
-
77
-
78
-
79
-
80
-
81
-
82
-
83
-
84
-
85
-
86
-
87
-
88
-
89
-
90
-
91
-
92
-
93
-
94
-
95
-
96
-
97
-
98
-
99
-
100
-
101
-
102
-
103
-
104
-
105
-
106
-
107
-
108
-
109
-
110
-
111
-
112
-
113
-
114
-
115
-
116
-
117
-
118
-
119
-
120
-
121
-
122
-
123
-
124
-
125
-
126
-
127
-
128
-
129
-
130
-
131
-
132
-
133
-
134
-
135
-
136
-
137
-
138
-
139
-
140
-
141
-
142
-
143
-
144
-
145
-
146
-
147
-
148
-
149
-
150
-
151
-
152
-
153
-
154
-
155
-
156
-
157
-
158
-
159
-
160
-
161
-
162
-
163
-
164
-
165
-
166
-
167
-
168
-
169
-
170
-
171
-
172
-
173
-
174
-
175
-
176
-
177
-
178
-
179
-
180
-
181
-
182
-
183
-
184
-
185
-
186
-
187
-
188
-
189
-
190
-
191
-
192
-
193
-
194
-
195
-
196
-
197
-
198
-
199
-
200
-
201
-
202
-
203
-
204
-
205
-
206
-
207
-
208
-
209
-
210
-
211
-
212
-
213
-
214
-
215
-
216
-
217
-
218
-
219
-
220
-
221
-
222
-
223
-
224
-
225
-
226
-
227
-
228
-
229
-
230
-
231
-
232
-
233
-
234
-
235
-
236
-
237
-
238
-
239
-
240
-
241
-
242
-
243
-
244
-
245
-
246
-
247
-
248
-
249
-
250
-
251
-
252
-
253
-
254
-
255
-
256
-
257
-
258
-
259
-
260
-
261
-
262
-
263
-
264
-
265
-
266
-
267
-
268
-
269
-
270
-
271
-
272
-
273
-
274
-
275
-
276
-
277
-
278
-
279
-
280
-
281
-
282
-
283
-
284
-
285
-
286
-
287
-
288
-
289
-
290
-
291
-
292
-
293
-
294
-
295
-
296
-
297
-
298
-
299
-
300
-
301
-
302
-
303
-
304
-
305
-
306
-
307
-
308
-
309
-
310
-
311
-
312
-
313
-
314
-
315
-
316
-
317
-
318
-
319
-
320
-
321
-
322
-
323
-
324
-
325
-
326
-
327
-
328
-
329
-
330
-
331
-
332
-
333
-
334
-
335
-
336
-
337
-
338
-
339
-
340
-
341
-
342
-
343
-
344
-
345
-
346
-
347
-
348
-
349
-
350
-
351
-
352
-
353
-
354
-
355
-
356
-
357
-
358
-
359
-
360
-
361
-
362
-
363
-
364
-
365
-
366
-
367
-
368
-
369
-
370
-
371
-
372
-
373
-
374
-
375
-
376
-
377
-
378
-
379
-
380
-
381
-
382
-
383
-
384
-
385
-
386
-
387
-
388
-
389
-
390
-
391
-
392
-
393
-
394
-
395
-
396
-
397
-
398
-
399
-
400
-
401
-
402
-
403
-
404
-
405
-
406
-
407
-
408
-
409
-
410
-
411
-
412
-
413
-
414
-
415
-
416
-
417
-
418
-
419
-
420
-
421
-
422
-
423
-
424
-
425
-
426
-
427
-
428
-
429
-
430
-
431
-
432
-
433
-
434
-
435
-
436
-
437
-
438
-
439
-
440
-
441
-
442
-
443
-
444
-
445
 |
 |

13RBS Group 2010
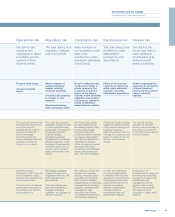
Our business and our strategy
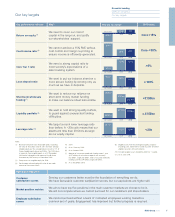
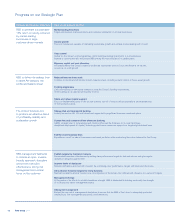
Progress on our Strategic Plan
Targets by 2013
All our main Core businesses sustain
positions amongst the leaders in their
markets
Sustainable 5 -10% organic
growth in “normal” times
Core cost:income ratio
<50%
Implemented in 2009 and on going
Group leverage below 20x, in line with
strongest global peers
Group loan:deposit ratio of c.100%
Short-term wholesale funding
<£150 billion
Liquidity reserves of c.£150 billion
Core Tier 1 capital ratio >8%
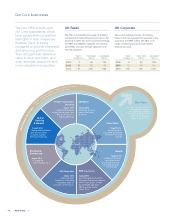
Two-thirds of Group profit and
revenue to come from retail and
commercial banking
GBM to account for approximately
one-third of Group profit and revenue
Run-down of the Non-Core Division
All implemented in 2009
and continuing to 2013
Our progress so far
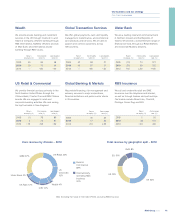
We maintained top five positions in the principal markets we compete in. For example: •Top two in UK retail and
commercial banking •Top five in US retail and commercial banking in our chosen regional markets •Top five in
most principal investment banking markets e.g. foreign exchange. We won't compete where we can't succeed for
our customers and shareholders.
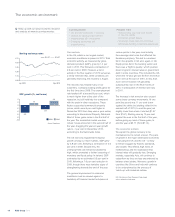
The economic environment showed signs of improvement in 2010 but continued volatility and monetary policy
interventions in some countries in which the Group operates meant 2010 was still far from a normal year. Our core
businesses remain resilient, and, we believe, are strongly positioned to achieve targeted growth levels when the
major economies in which they operate fully normalise.
We have already reached our goal of delivering £2.5 billion of annualised cost savings from across the Group.
Annual savings are now forecast to exceed £3 billion by 2013. The Core cost:income ratio was 56% for 2010,
down from a peak of 97% in 2008, and on track to hit our 2013 target.
In 2009, each business was made fully accountable for the costs it incurs and capital it requires through the
implementation of divisional level targets for risk weighted assets, return on equity and cost:income ratios.
In 2010, this enabled us to focus accurately on the individual performance of our divisions as well as
capture the benefits of our universal banking model.
In 2010, Non-Core run-off accelerated, reducing the division’s funded assets to £138 billion, over £100 billion lower
than the December 2008 portfolio of £258 billion. Our Tier 1 leverage ratio decreased slightly in 2010 to 16.9x,
down from 17.0x in 2009.
We improved our Group loan-to-deposit ratio to 117% by the end of 2010, compared with 135% a year earlier, and,
by December 2010, our Core businesses were taking in £1 of deposits for every £1 of loans made. We continued to
reduce our reliance on wholesale funding, from £250 billion of short-term wholesale funding in 2009 to £157 billion in
2010. Our liquidity reserves were in line with our 2013 target at the end of 2010, at £155 billion.
Our Core Tier 1 capital ratio was 10.7% at the end of 2010, which although marginally lower than a year earlier, is
above our 2013 target and positions the Group well to deal with future regulatory changes in capital requirements.
Retail and commercial businesses generated around 51% of the Core operating profit for 2010, moving towards the
achievement of our 2013 target. In the UK, we exceeded our £8 billion mortgage net lending target and £50 billion
gross business lending target for the 12 month period to February 2011.
GBM reported 2010 performance that was down from a highly unusual 2009. The division sustained its core
product and market strengths, supporting its target customer franchises whilst continuing to implement its
substantial change programme and invest for future growth. GBM third party assets, excluding derivatives, were
down £15.5 billion compared with 31 December 2009 and its proportion of our Core operating profit has reduced
during 2010 to 45%.
We made substantial progress in our disposal programme over the course of 2010; 20 business disposals were
signed or completed. The disposal programme reduced Non-Core funded assets by £33 billion over the course of
2010, with a further £12 billion of Non-Core disposals signed and due to complete in the course of 2011. By 31
December 2010 the Group had also completed the sales of GMS and substantially all of its interest in RBS Sempra
Commodities, and had agreed the sale of RBS England and Wales and NatWest Scotland branch-based businesses
to Santander. This demonstrates solid progress towards the achievement of our EC divestment commitments.
We have announced clearly defined financial targets, at both individual division and Group level which we report
against on a quarterly basis. Performance against the Group’s strategy, as announced in 2009, can be tracked at
our “Changing the bank” website (https://changingthebank.rbs.com).
We provide financial information to the market quarterly.
We continue to track customer satisfaction scores and market position metrics, for each of our core businesses,
to make sure we achieve our goal of serving customers well.
We made comprehensive changes to the Board and Executive Management team in 2009, so 2010 was a year of
relative stability. Brendan Nelson was appointed as a new Non-executive Director with effect from 1 April 2010, and is
now Chair of the Group Audit Committee. Penny Hughes joined the Group Board on 1 January 2010, also as a
Non-executive Director, and assumed the responsibility of Chair of our Remuneration Committee.
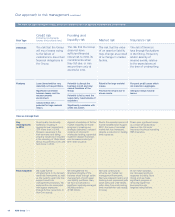
RBS Risk Management is aligned to support the Group’s stated objective of standalone strength by 2013,
as measured by reaching, and retaining, a standalone credit rating in line with the strongest international peer group.
For an overview of how this is working in practice, see pages 17 to 19.