RBS 2010 Annual Report Download - page 329
Download and view the complete annual report
Please find page 329 of the 2010 RBS annual report below. You can navigate through the pages in the report by either clicking on the pages listed below, or by using the keyword search tool below to find specific information within the annual report.-
 1
1 -
2
-
3
-
4
-
5
-
6
-
7
-
8
-
9
-
10
-
11
-
12
-
13
-
14
-
15
-
16
-
17
-
18
-
19
-
20
-
21
-
22
-
23
-
24
-
25
-
26
-
27
-
28
-
29
-
30
-
31
-
32
-
33
-
34
-
35
-
36
-
37
-
38
-
39
-
40
-
41
-
42
-
43
-
44
-
45
-
46
-
47
-
48
-
49
-
50
-
51
-
52
-
53
-
54
-
55
-
56
-
57
-
58
-
59
-
60
-
61
-
62
-
63
-
64
-
65
-
66
-
67
-
68
-
69
-
70
-
71
-
72
-
73
-
74
-
75
-
76
-
77
-
78
-
79
-
80
-
81
-
82
-
83
-
84
-
85
-
86
-
87
-
88
-
89
-
90
-
91
-
92
-
93
-
94
-
95
-
96
-
97
-
98
-
99
-
100
-
101
-
102
-
103
-
104
-
105
-
106
-
107
-
108
-
109
-
110
-
111
-
112
-
113
-
114
-
115
-
116
-
117
-
118
-
119
-
120
-
121
-
122
-
123
-
124
-
125
-
126
-
127
-
128
-
129
-
130
-
131
-
132
-
133
-
134
-
135
-
136
-
137
-
138
-
139
-
140
-
141
-
142
-
143
-
144
-
145
-
146
-
147
-
148
-
149
-
150
-
151
-
152
-
153
-
154
-
155
-
156
-
157
-
158
-
159
-
160
-
161
-
162
-
163
-
164
-
165
-
166
-
167
-
168
-
169
-
170
-
171
-
172
-
173
-
174
-
175
-
176
-
177
-
178
-
179
-
180
-
181
-
182
-
183
-
184
-
185
-
186
-
187
-
188
-
189
-
190
-
191
-
192
-
193
-
194
-
195
-
196
-
197
-
198
-
199
-
200
-
201
-
202
-
203
-
204
-
205
-
206
-
207
-
208
-
209
-
210
-
211
-
212
-
213
-
214
-
215
-
216
-
217
-
218
-
219
-
220
-
221
-
222
-
223
-
224
-
225
-
226
-
227
-
228
-
229
-
230
-
231
-
232
-
233
-
234
-
235
-
236
-
237
-
238
-
239
-
240
-
241
-
242
-
243
-
244
-
245
-
246
-
247
-
248
-
249
-
250
-
251
-
252
-
253
-
254
-
255
-
256
-
257
-
258
-
259
-
260
-
261
-
262
-
263
-
264
-
265
-
266
-
267
-
268
-
269
-
270
-
271
-
272
-
273
-
274
-
275
-
276
-
277
-
278
-
279
-
280
-
281
-
282
-
283
-
284
-
285
-
286
-
287
-
288
-
289
-
290
-
291
-
292
-
293
-
294
-
295
-
296
-
297
-
298
-
299
-
300
-
301
-
302
-
303
-
304
-
305
-
306
-
307
-
308
-
309
-
310
-
311
-
312
-
313
-
314
-
315
-
316
-
317
-
318
-
 319
319 -
 320
320 -
 321
321 -
 322
322 -
 323
323 -
 324
324 -
 325
325 -
 326
326 -
 327
327 -
 328
328 -
 329
329 -
 330
330 -
 331
331 -
 332
332 -
 333
333 -
 334
334 -
 335
335 -
 336
336 -
 337
337 -
 338
338 -
 339
339 -
340
-
341
-
342
-
343
-
344
-
345
-
346
-
347
-
348
-
349
-
350
-
351
-
352
-
353
-
354
-
355
-
356
-
357
-
358
-
359
-
360
-
361
-
362
-
363
-
364
-
365
-
366
-
367
-
368
-
369
-
370
-
371
-
372
-
373
-
374
-
375
-
376
-
377
-
378
-
379
-
380
-
381
-
382
-
383
-
384
-
385
-
386
-
387
-
388
-
389
-
390
-
391
-
392
-
393
-
394
-
395
-
396
-
397
-
398
-
399
-
400
-
401
-
402
-
403
-
404
-
405
-
406
-
407
-
408
-
409
-
410
-
411
-
412
-
413
-
414
-
415
-
416
-
417
-
418
-
419
-
420
-
421
-
422
-
423
-
424
-
425
-
426
-
427
-
428
-
429
-
430
-
431
-
432
-
433
-
434
-
435
-
436
-
437
-
438
-
439
-
440
-
441
-
442
-
443
-
444
-
445
 |
 |

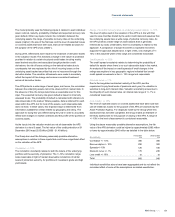
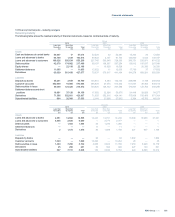
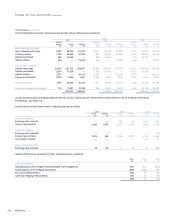
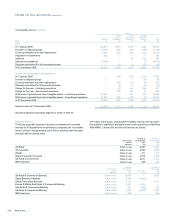
Company
0-3 months 3-12 months 1-3 years 3-5 years 5-10 years 10-20 years
2010 £m £m £m £m £m £m
Customer accounts 1,029 — — — — —
Debt securities in issue 589 1,089 6,436 128 1,248 —
Subordinated liabilities 317 310 1,357 1,873 1,998 3,482
1,935 1,399 7,793 2,001 3,246 3,482
2009
Deposits by banks 93 — — — — —
Customer accounts 964 12,337 — — — —
Debt securities in issue 3,132 2,080 2,732 3,615 1,255 —
Derivatives held for hedging (5) (23) (19) 13 64 —
Subordinated liabilities 106 406 1,146 2,010 2,634 3,923
4,290 14,800 3,859 5,638 3,953 3,923
2008
Deposits by banks 116 1,707 — — — —
Debt securities in issue 4,448 3,105 1,334 6,105 — —
Derivatives held for hedging 186 16 30 1 — —
Subordinated liabilities 158 458 1,464 1,376 4,241 5,149
4,908 5,286 2,828 7,482 4,241 5,149
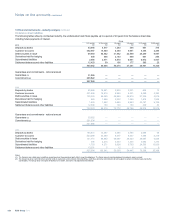
The table above shows the timing of cash outflows to settle financial
liabilities, prepared on the following basis:
Financial liabilities are included at the earliest date on which the
counterparty can require repayment regardless of whether or not such
early repayment results in a penalty. If repayment is triggered by, or is
subject to, specific criteria such as market price hurdles being reached,
the liability is included at the earliest possible date that the conditions
could be fulfilled without considering the probability of the conditions
being met. For example, if a structured note is automatically prepaid
when an equity index exceeds a certain level, the cash outflow will be
included in the less than three months' period whatever the level of the
index at the year end. The settlement date of debt securities in issue
given by certain securitisation vehicles consolidated by the Group
depends on when cash flows are received from the securitised assets.
Where these assets are prepayable, the timing of the cash outflow
relating to securities assumes that each asset will be prepaid at the
earliest possible date.
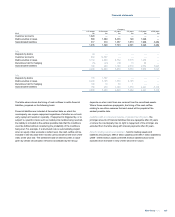
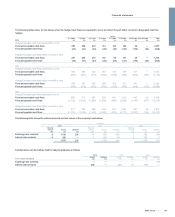
Liabilities with a contractual maturity of greater than 20 years - the
principal amounts of financial liabilities that are repayable after 20 years
or where the counterparty has no right to repayment of the principal, are
excluded from the table along with interest payments after 20 years.
Held-for-trading assets and liabilities - held-for-trading assets and
liabilities amounting to £665.0 billion (assets) and £586.1 billion (liabilities)
(2009 - £650.5 billion assets and £568.5 billion liabilities) have been
excluded from the table in view of their short term nature.
327RBS Group 2010
Financial statements