RBS 2010 Annual Report Download - page 97
Download and view the complete annual report
Please find page 97 of the 2010 RBS annual report below. You can navigate through the pages in the report by either clicking on the pages listed below, or by using the keyword search tool below to find specific information within the annual report.-
 1
1 -
2
-
3
-
4
-
5
-
6
-
7
-
8
-
9
-
10
-
11
-
12
-
13
-
14
-
15
-
16
-
17
-
18
-
19
-
20
-
21
-
22
-
23
-
24
-
25
-
26
-
27
-
28
-
29
-
30
-
31
-
32
-
33
-
34
-
35
-
36
-
37
-
38
-
39
-
40
-
41
-
42
-
43
-
44
-
45
-
46
-
47
-
48
-
49
-
50
-
51
-
52
-
53
-
54
-
55
-
56
-
57
-
58
-
59
-
60
-
61
-
62
-
63
-
64
-
65
-
66
-
67
-
68
-
69
-
70
-
71
-
72
-
73
-
74
-
75
-
76
-
77
-
78
-
79
-
80
-
81
-
82
-
83
-
84
-
85
-
86
-
 87
87 -
 88
88 -
 89
89 -
 90
90 -
 91
91 -
 92
92 -
 93
93 -
 94
94 -
 95
95 -
 96
96 -
 97
97 -
 98
98 -
 99
99 -
 100
100 -
 101
101 -
 102
102 -
 103
103 -
 104
104 -
 105
105 -
 106
106 -
 107
107 -
108
-
109
-
110
-
111
-
112
-
113
-
114
-
115
-
116
-
117
-
118
-
119
-
120
-
121
-
122
-
123
-
124
-
125
-
126
-
127
-
128
-
129
-
130
-
131
-
132
-
133
-
134
-
135
-
136
-
137
-
138
-
139
-
140
-
141
-
142
-
143
-
144
-
145
-
146
-
147
-
148
-
149
-
150
-
151
-
152
-
153
-
154
-
155
-
156
-
157
-
158
-
159
-
160
-
161
-
162
-
163
-
164
-
165
-
166
-
167
-
168
-
169
-
170
-
171
-
172
-
173
-
174
-
175
-
176
-
177
-
178
-
179
-
180
-
181
-
182
-
183
-
184
-
185
-
186
-
187
-
188
-
189
-
190
-
191
-
192
-
193
-
194
-
195
-
196
-
197
-
198
-
199
-
200
-
201
-
202
-
203
-
204
-
205
-
206
-
207
-
208
-
209
-
210
-
211
-
212
-
213
-
214
-
215
-
216
-
217
-
218
-
219
-
220
-
221
-
222
-
223
-
224
-
225
-
226
-
227
-
228
-
229
-
230
-
231
-
232
-
233
-
234
-
235
-
236
-
237
-
238
-
239
-
240
-
241
-
242
-
243
-
244
-
245
-
246
-
247
-
248
-
249
-
250
-
251
-
252
-
253
-
254
-
255
-
256
-
257
-
258
-
259
-
260
-
261
-
262
-
263
-
264
-
265
-
266
-
267
-
268
-
269
-
270
-
271
-
272
-
273
-
274
-
275
-
276
-
277
-
278
-
279
-
280
-
281
-
282
-
283
-
284
-
285
-
286
-
287
-
288
-
289
-
290
-
291
-
292
-
293
-
294
-
295
-
296
-
297
-
298
-
299
-
300
-
301
-
302
-
303
-
304
-
305
-
306
-
307
-
308
-
309
-
310
-
311
-
312
-
313
-
314
-
315
-
316
-
317
-
318
-
319
-
320
-
321
-
322
-
323
-
324
-
325
-
326
-
327
-
328
-
329
-
330
-
331
-
332
-
333
-
334
-
335
-
336
-
337
-
338
-
339
-
340
-
341
-
342
-
343
-
344
-
345
-
346
-
347
-
348
-
349
-
350
-
351
-
352
-
353
-
354
-
355
-
356
-
357
-
358
-
359
-
360
-
361
-
362
-
363
-
364
-
365
-
366
-
367
-
368
-
369
-
370
-
371
-
372
-
373
-
374
-
375
-
376
-
377
-
378
-
379
-
380
-
381
-
382
-
383
-
384
-
385
-
386
-
387
-
388
-
389
-
390
-
391
-
392
-
393
-
394
-
395
-
396
-
397
-
398
-
399
-
400
-
401
-
402
-
403
-
404
-
405
-
406
-
407
-
408
-
409
-
410
-
411
-
412
-
413
-
414
-
415
-
416
-
417
-
418
-
419
-
420
-
421
-
422
-
423
-
424
-
425
-
426
-
427
-
428
-
429
-
430
-
431
-
432
-
433
-
434
-
435
-
436
-
437
-
438
-
439
-
440
-
441
-
442
-
443
-
444
-
445
 |
 |

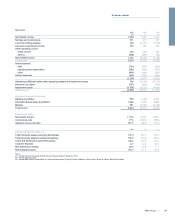
2010 2009 2008
£bn £bn £bn
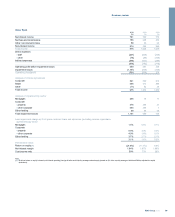
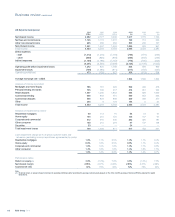
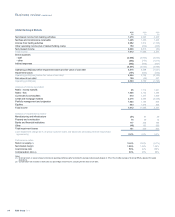
Capital and balance sheet
Loans and advances to customers 75.1 90.9 168.7
Loans and advances to banks 44.5 36.9 55.5
Reverse repos 94.8 73.3 88.8
Securities 119.2 106.0 127.5
Cash and eligible bills 38.8 74.0 20.2
Other 24.3 31.1 38.0
Total third party assets (excluding derivatives mark-to-market) 396.7 412.2 498.7
Net derivative assets (after netting) 37.4 68.0 121.0
Customer deposits (excluding repos) 38.9 46.9 87.8
Risk elements in lending 1.7 1.8 0.9
Loan:deposit ratio (excluding repos) 193% 194% 192%
Risk-weighted assets 146.9 123.7 151.8
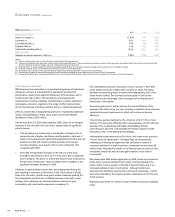
2010 compared with 2009
Afall in operating profit, excluding fair value of own debt, of 42% year on
year reflects sharply reduced revenue partially offset by lower costs and a
significant improvement in impairments.
Total income was £3,146 million lower in 2010 driven by increased risk
aversion in the market during Q3 and Q4 2010, combined with the non-
repeat of favourable market conditions seen in the first half of 2009.
xHigher revenue across the Rates and Currencies businesses during
2009 was driven by rapidly falling interest rates and wide bid-offer
spreads generating exceptional revenue opportunities, which have
not been repeated in 2010.
xThe Credit Markets business remained broadly flat, supported by
strong Mortgage Trading income where customer demand remained
buoyant during 2010.
xIncreased revenue from Portfolio Management was driven by
disciplined lending alongside a reduction in balance sheet
management activities and associated costs.
Expenses fell by 6% to £4,397 million. This was largely driven by a
decrease in staff costs, including on-going benefits from cost synergies.
The low level of impairments in 2010 reflected a small number of specific
cases partially offset by an improved picture on latent loss provisions.
This contrasted with 2009, which witnessed a significantly higher level of
specific impairments.
At 16.6%, return on equity remained consistent with the 15% targeted
over the business cycle in GBM’s strategic plan. The compensation ratio
of 34% was below that of peers.
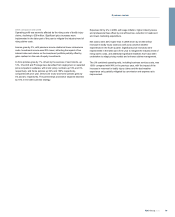
2009 compared with 2008
Operating profit, excluding the fair value of own debt, improved to £5,758
million in 2009, compared with an operating loss of £2,153 million in
2008. Although the buoyant market conditions experienced in the first
quarter levelled off over the course of the year, the refocusing of the
business on its core franchises was successful. GBM has tightened its
balance sheet management over the course of the year, with disciplined
deployment of capital to support its targeted client base.
In an often volatile market environment, GBM responded quickly to its
clients' needs to strengthen their balance sheets and to take advantage
of the attractive environment for debt and equity issues. RBS participated
in the five largest equity issues worldwide in 2009, and in six out of the
ten largest debt capital markets transactions.
Income grew significantly, reflecting a very strong first quarter benefiting
from market volatility, client activity and a marked improvement from
credit and mortgage markets. Rates flow business, up 127%, benefited
from good client activity, while strong equity capital markets drove a
fourfold increase in Equities.
Portfolio management and origination grew 39% as financial institutions
and corporate clients refinanced through the debt capital markets. The
refocused credit and mortgage markets delivered a much improved result
from greater liquidity and a more positive trading environment.
Despite quarterly movement in the Group's credit spreads, overall
spreads remained broadly flat over the year resulting in a small loss from
movements in the fair value of own debt compared with a £357 million
gain in 2008.
Expenses increased 17%, reflecting higher performance-related costs
and the impact of adverse exchange rate movements, partly offset by
restructuring and efficiency benefits. Less than half of the change in staff
costs related to increases in 2009 bonus awards.
95RBS Group 2010
Business review