RBS 2010 Annual Report Download - page 197
Download and view the complete annual report
Please find page 197 of the 2010 RBS annual report below. You can navigate through the pages in the report by either clicking on the pages listed below, or by using the keyword search tool below to find specific information within the annual report.-
 1
1 -
2
-
3
-
4
-
5
-
6
-
7
-
8
-
9
-
10
-
11
-
12
-
13
-
14
-
15
-
16
-
17
-
18
-
19
-
20
-
21
-
22
-
23
-
24
-
25
-
26
-
27
-
28
-
29
-
30
-
31
-
32
-
33
-
34
-
35
-
36
-
37
-
38
-
39
-
40
-
41
-
42
-
43
-
44
-
45
-
46
-
47
-
48
-
49
-
50
-
51
-
52
-
53
-
54
-
55
-
56
-
57
-
58
-
59
-
60
-
61
-
62
-
63
-
64
-
65
-
66
-
67
-
68
-
69
-
70
-
71
-
72
-
73
-
74
-
75
-
76
-
77
-
78
-
79
-
80
-
81
-
82
-
83
-
84
-
85
-
86
-
87
-
88
-
89
-
90
-
91
-
92
-
93
-
94
-
95
-
96
-
97
-
98
-
99
-
100
-
101
-
102
-
103
-
104
-
105
-
106
-
107
-
108
-
109
-
110
-
111
-
112
-
113
-
114
-
115
-
116
-
117
-
118
-
119
-
120
-
121
-
122
-
123
-
124
-
125
-
126
-
127
-
128
-
129
-
130
-
131
-
132
-
133
-
134
-
135
-
136
-
137
-
138
-
139
-
140
-
141
-
142
-
143
-
144
-
145
-
146
-
147
-
148
-
149
-
150
-
151
-
152
-
153
-
154
-
155
-
156
-
157
-
158
-
159
-
160
-
161
-
162
-
163
-
164
-
165
-
166
-
167
-
168
-
169
-
170
-
171
-
172
-
173
-
174
-
175
-
176
-
177
-
178
-
179
-
180
-
181
-
182
-
183
-
184
-
185
-
186
-
 187
187 -
 188
188 -
 189
189 -
 190
190 -
 191
191 -
 192
192 -
 193
193 -
 194
194 -
 195
195 -
 196
196 -
 197
197 -
 198
198 -
 199
199 -
 200
200 -
 201
201 -
 202
202 -
 203
203 -
 204
204 -
 205
205 -
 206
206 -
 207
207 -
208
-
209
-
210
-
211
-
212
-
213
-
214
-
215
-
216
-
217
-
218
-
219
-
220
-
221
-
222
-
223
-
224
-
225
-
226
-
227
-
228
-
229
-
230
-
231
-
232
-
233
-
234
-
235
-
236
-
237
-
238
-
239
-
240
-
241
-
242
-
243
-
244
-
245
-
246
-
247
-
248
-
249
-
250
-
251
-
252
-
253
-
254
-
255
-
256
-
257
-
258
-
259
-
260
-
261
-
262
-
263
-
264
-
265
-
266
-
267
-
268
-
269
-
270
-
271
-
272
-
273
-
274
-
275
-
276
-
277
-
278
-
279
-
280
-
281
-
282
-
283
-
284
-
285
-
286
-
287
-
288
-
289
-
290
-
291
-
292
-
293
-
294
-
295
-
296
-
297
-
298
-
299
-
300
-
301
-
302
-
303
-
304
-
305
-
306
-
307
-
308
-
309
-
310
-
311
-
312
-
313
-
314
-
315
-
316
-
317
-
318
-
319
-
320
-
321
-
322
-
323
-
324
-
325
-
326
-
327
-
328
-
329
-
330
-
331
-
332
-
333
-
334
-
335
-
336
-
337
-
338
-
339
-
340
-
341
-
342
-
343
-
344
-
345
-
346
-
347
-
348
-
349
-
350
-
351
-
352
-
353
-
354
-
355
-
356
-
357
-
358
-
359
-
360
-
361
-
362
-
363
-
364
-
365
-
366
-
367
-
368
-
369
-
370
-
371
-
372
-
373
-
374
-
375
-
376
-
377
-
378
-
379
-
380
-
381
-
382
-
383
-
384
-
385
-
386
-
387
-
388
-
389
-
390
-
391
-
392
-
393
-
394
-
395
-
396
-
397
-
398
-
399
-
400
-
401
-
402
-
403
-
404
-
405
-
406
-
407
-
408
-
409
-
410
-
411
-
412
-
413
-
414
-
415
-
416
-
417
-
418
-
419
-
420
-
421
-
422
-
423
-
424
-
425
-
426
-
427
-
428
-
429
-
430
-
431
-
432
-
433
-
434
-
435
-
436
-
437
-
438
-
439
-
440
-
441
-
442
-
443
-
444
-
445
 |
 |

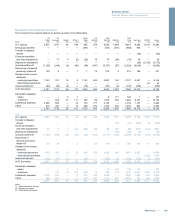
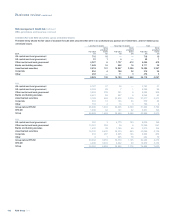
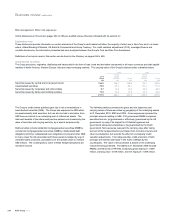
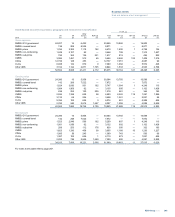
The VaR for the Group’s 2010 trading portfolios analysed by type of market risk exposure is shown below.
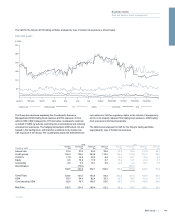
Daily VaR graph*
195RBS Group 2010
Business review
Risk and balance sheet management
50
100
150
200
250
300
January February March April May June July August September October November December
£ million
Interest rate Credit spread FX Equity Commodity Total
The Group has disclosed separately the Counterparty Exposure
Management (CEM) trading book exposure and the exposure of Core
without CEM. CEM manages the OTC derivative counterparty credit risk
on behalf of GBM, by actively controlling risk concentrations and reducing
unwanted risk exposures. The hedging transactions CEM enters into are
booked in the trading book, and therefore contribute to the market risk
VaR exposure of the Group. The counterparty exposures themselves are
not captured in VaR for regulatory capital. In the interest of transparency
and to more properly represent the trading book exposure, CEM trading
book exposure is disclosed separately.
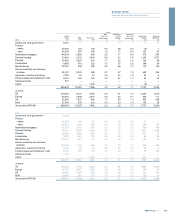
The table below analyses the VaR for the Group’s trading portfolios
segregated by type of market risk exposure.
2010 2009
Trading VaR
Average
£m
Period end
£m
Maximum
£m
Minimum
£m
Average
£m
Period end
£m
Maximum
£m
Minimum
£m
Interest rate 51.6 57.0 83.0 32.5 57.0 50.5 112.8 28.1
Credit spread 166.3 133.4 243.2 110.2 148.3 174.8 231.2 66.9
Currency 17.9 14.8 28.0 8.4 17.9 20.7 35.8 9.2
Equity 9.5 10.9 17.9 2.7 13.0 13.1 23.2 2.7
Commodity 9.5 0.5 18.1 0.5 14.3 8.9 32.1 6.5
Diversification (75.6) (86.1)
168.5 141.0 252.1 103.0 155.2 181.9 229.0 76.8
Core (Total) 103.6 101.2 153.4 58.3 101.5 127.3 137.8 54.8
CEM 53.3 54.6 82.4 30.3 29.7 38.6 41.3 11.5
Core excluding CEM 82.8 78.7 108.7 53.6 86.7 97.4 128.5 54.9
Non-Core 105.7 101.4 169.4 63.2 86.3 84.8 162.1 29.3
*unaudited