RBS 2010 Annual Report Download - page 77
Download and view the complete annual report
Please find page 77 of the 2010 RBS annual report below. You can navigate through the pages in the report by either clicking on the pages listed below, or by using the keyword search tool below to find specific information within the annual report.-
 1
1 -
2
-
3
-
4
-
5
-
6
-
7
-
8
-
9
-
10
-
11
-
12
-
13
-
14
-
15
-
16
-
17
-
18
-
19
-
20
-
21
-
22
-
23
-
24
-
25
-
26
-
27
-
28
-
29
-
30
-
31
-
32
-
33
-
34
-
35
-
36
-
37
-
38
-
39
-
40
-
41
-
42
-
43
-
44
-
45
-
46
-
47
-
48
-
49
-
50
-
51
-
52
-
53
-
54
-
55
-
56
-
57
-
58
-
59
-
60
-
61
-
62
-
63
-
64
-
65
-
66
-
 67
67 -
 68
68 -
 69
69 -
 70
70 -
 71
71 -
 72
72 -
 73
73 -
 74
74 -
 75
75 -
 76
76 -
 77
77 -
 78
78 -
 79
79 -
 80
80 -
 81
81 -
 82
82 -
 83
83 -
 84
84 -
 85
85 -
 86
86 -
 87
87 -
88
-
89
-
90
-
91
-
92
-
93
-
94
-
95
-
96
-
97
-
98
-
99
-
100
-
101
-
102
-
103
-
104
-
105
-
106
-
107
-
108
-
109
-
110
-
111
-
112
-
113
-
114
-
115
-
116
-
117
-
118
-
119
-
120
-
121
-
122
-
123
-
124
-
125
-
126
-
127
-
128
-
129
-
130
-
131
-
132
-
133
-
134
-
135
-
136
-
137
-
138
-
139
-
140
-
141
-
142
-
143
-
144
-
145
-
146
-
147
-
148
-
149
-
150
-
151
-
152
-
153
-
154
-
155
-
156
-
157
-
158
-
159
-
160
-
161
-
162
-
163
-
164
-
165
-
166
-
167
-
168
-
169
-
170
-
171
-
172
-
173
-
174
-
175
-
176
-
177
-
178
-
179
-
180
-
181
-
182
-
183
-
184
-
185
-
186
-
187
-
188
-
189
-
190
-
191
-
192
-
193
-
194
-
195
-
196
-
197
-
198
-
199
-
200
-
201
-
202
-
203
-
204
-
205
-
206
-
207
-
208
-
209
-
210
-
211
-
212
-
213
-
214
-
215
-
216
-
217
-
218
-
219
-
220
-
221
-
222
-
223
-
224
-
225
-
226
-
227
-
228
-
229
-
230
-
231
-
232
-
233
-
234
-
235
-
236
-
237
-
238
-
239
-
240
-
241
-
242
-
243
-
244
-
245
-
246
-
247
-
248
-
249
-
250
-
251
-
252
-
253
-
254
-
255
-
256
-
257
-
258
-
259
-
260
-
261
-
262
-
263
-
264
-
265
-
266
-
267
-
268
-
269
-
270
-
271
-
272
-
273
-
274
-
275
-
276
-
277
-
278
-
279
-
280
-
281
-
282
-
283
-
284
-
285
-
286
-
287
-
288
-
289
-
290
-
291
-
292
-
293
-
294
-
295
-
296
-
297
-
298
-
299
-
300
-
301
-
302
-
303
-
304
-
305
-
306
-
307
-
308
-
309
-
310
-
311
-
312
-
313
-
314
-
315
-
316
-
317
-
318
-
319
-
320
-
321
-
322
-
323
-
324
-
325
-
326
-
327
-
328
-
329
-
330
-
331
-
332
-
333
-
334
-
335
-
336
-
337
-
338
-
339
-
340
-
341
-
342
-
343
-
344
-
345
-
346
-
347
-
348
-
349
-
350
-
351
-
352
-
353
-
354
-
355
-
356
-
357
-
358
-
359
-
360
-
361
-
362
-
363
-
364
-
365
-
366
-
367
-
368
-
369
-
370
-
371
-
372
-
373
-
374
-
375
-
376
-
377
-
378
-
379
-
380
-
381
-
382
-
383
-
384
-
385
-
386
-
387
-
388
-
389
-
390
-
391
-
392
-
393
-
394
-
395
-
396
-
397
-
398
-
399
-
400
-
401
-
402
-
403
-
404
-
405
-
406
-
407
-
408
-
409
-
410
-
411
-
412
-
413
-
414
-
415
-
416
-
417
-
418
-
419
-
420
-
421
-
422
-
423
-
424
-
425
-
426
-
427
-
428
-
429
-
430
-
431
-
432
-
433
-
434
-
435
-
436
-
437
-
438
-
439
-
440
-
441
-
442
-
443
-
444
-
445
 |
 |

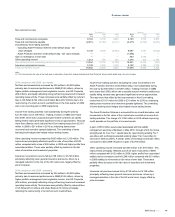
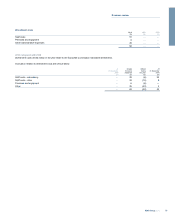
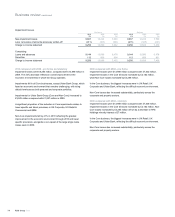
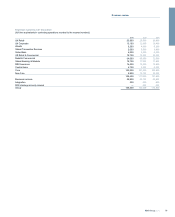
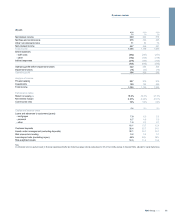
Credit market exposures
Credit and other market (losses)/gains (1) 2010
£m
2009
£m
2008
£m
Monoline exposures (5) (2,387) (3,093)
CDPCs (2) (141) (957) (615)
Asset-backed products 235 (288) (4,778)
Other credit exotics 77 (558) (947)
Equities (17) (47) (948)
Leveraged finance —— (1,088)
Banking book hedges (82) (1,727) 1,642
Other (455) (188) (268)
Net credit and other market losses (388) (6,152) (10,095)
Notes:
(1) Included in 'Income from trading activities', significantly all in Non-Core.
(2) Credit derivative product companies.
2010 compared with 2009
Tightening credit spreads, a recovery in underlying asset prices and
gains on sales of asset-backed products during 2010 contributed to
significantly lower losses in 2010. Unwinding of some banking book
hedges in 2010 also resulted in lower losses. Monoline losses of £2,387
million in 2009 reflected the widening credit spreads and lower recovery
rates. CDPC losses were higher in 2009 due to losses on market risk
hedges.
Other losses include credit valuation and other reserves against
derivative counterparties other than monolines and CDPCs. Losses
increased due to rating downgrades as well as other losses on specific
deals.
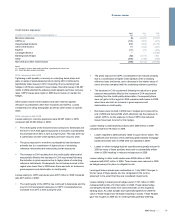
2009 compared with 2008
Losses relating to monoline exposures were £2,387 million in 2009
compared with £3,093 million in 2008.
xThe credit quality of the monolines has continued to deteriorate and
the level of CVA held against exposures to monoline counterparties
has increased from 52% to 62% during the year. This was driven by
acombination of wider credit spreads and lower recovery rates.
xThe gross exposure to monoline counterparties has decreased
primarily due to a combination of higher prices of underlying
reference instruments and restructuring certain exposures.
xThe increase in CVA resulting from the credit quality deterioration
was partially offset by the decrease in CVA requirement following
the reduction in gross exposure due to higher prices of underlying
reference instruments. Consequently the net losses incurred in this
regard were lower than in 2008 when there was both an increase in
gross exposure and deterioration in credit quality.
Losses relating to CDPC exposures were £957 million in 2009 compared
with £615 million in 2008.
xThe credit quality of the CDPCs has continued to deteriorate and the
level of CVA held against exposures to CDPC counterparties has
increased from 27% to 39% during the year.
xThe gross exposure to CDPC counterparties has reduced primarily
due to a combination of tighter credit spreads of the underlying
reference loans and bonds, and a decrease in the relative value of
senior tranches compared with the underlying reference portfolios.
xThe decrease in CVA requirement following the reduction in gross
exposure was partially offset by the increase in CVA requirement
resulting from the credit quality deterioration. Consequently there
were net gains in this regard in 2009 compared with losses in 2008
when there was both an increase in gross exposure and
deterioration in credit quality.
xNet losses were incurred in 2009 due to hedges put in place at the
end of 2008 and during 2009 which effectively cap the exposure to
certain CDPCs. As the exposure to these CDPCs has reduced,
losses have been incurred on the hedges.
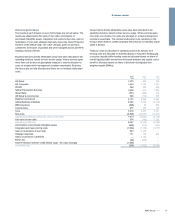
Losses relating to asset-backed products were £288 million in 2009
compared with £4,778 million in 2008.
xLosses reported in 2009 primarily relate to super senior CDOs. The
significant price declines of the underlying predominantly mortgage-
backed securities seen in 2008 were not repeated in 2009.
xLosses on other mortgage backed securities were greatly reduced in
2009 as many of these positions were sold or substantially written
down in 2008 resulting in reduced net exposure in 2009.
Losses relating to other credit exotics were £558 million in 2009
compared with £947 million in 2008. These losses were reduced in 2009
as hedges were put in place to mitigate the risk.
Leveraged finance assets were reclassified on 1 July 2009. Changes in
the fair value of these assets are only recognised in the income
statement to the extent that they are considered impairments.
Losses relating to banking book hedges were £1,727 million in 2009
compared with profits of £1,642 million in 2008. These trades hedge
counterparty risk that arises from loans and bonds on the regulatory
banking book. As credit spreads have generally tightened in 2009 the
value of these hedges has decreased resulting in losses. These hedges
gave rise to gains in 2008 due to credit spreads generally widening.
75RBS Group 2010
Business review